48 questions. Try each one, then open the answer to check yourself and read the explanation.
Question 1
Theory of Consumer Behaviour
With a given level of money income, a consumer maximizes satisfaction from the consumption of goods and services when the
A.total utility derived from each good or service is increasing at an increasing rate
B.marginal utility derived from each good or service is increasing at the same rate
C.marginal utility derived per naira spent is the same for all the goods and services
D.total utility derived from all the goods and services is large.
Show the answer and explanation
Answer: C (marginal utility derived per naira spent is the same for all the goods and services)
Explanation
This is the equi-marginal principle: if one good gave more utility per naira, switching spending to it would raise satisfaction, so the best point is where MU per naira is equal for all goods.
Ike's scale of preference reveals that he prefers bananas to pawpaw, pawpaw to oranges and oranges to bananas. Ike's preferences are therefore
A.inconsistent
B.consistent
C.transitive
D.rational.
Show the answer and explanation
Answer: A (inconsistent)
Explanation
If he prefers bananas to pawpaw and pawpaw to oranges, he should prefer bananas to oranges. Preferring oranges to bananas breaks this, so his preferences are inconsistent.
Given that at the beginning of 1973, Nigeria with a birth rate of 3% per annum had a population of 75 million. This implied that in that year
A.the population increased by 2.25 million
B.there were 2.25 million live births
C.the government have to make provisions for 2.25 million children
D.2.25 million children were born.
Show the answer and explanation
Answer: B (there were 2.25 million live births)
Explanation
Birth rate measures live births: 3% of 75 million = 2.25 million live births. The population grows by births minus deaths, so it did not necessarily rise by 2.25 million.
When a country's population is experiencing increasing returns, that country is said to be
A.overpopulated
B.economically poor
C.over producing goods and services
D.underpopulated
Show the answer and explanation
Answer: D (underpopulated)
Explanation
If adding people raises output per head, the country does not yet have enough people to use its resources fully: it is below the optimum population, so it is underpopulated.
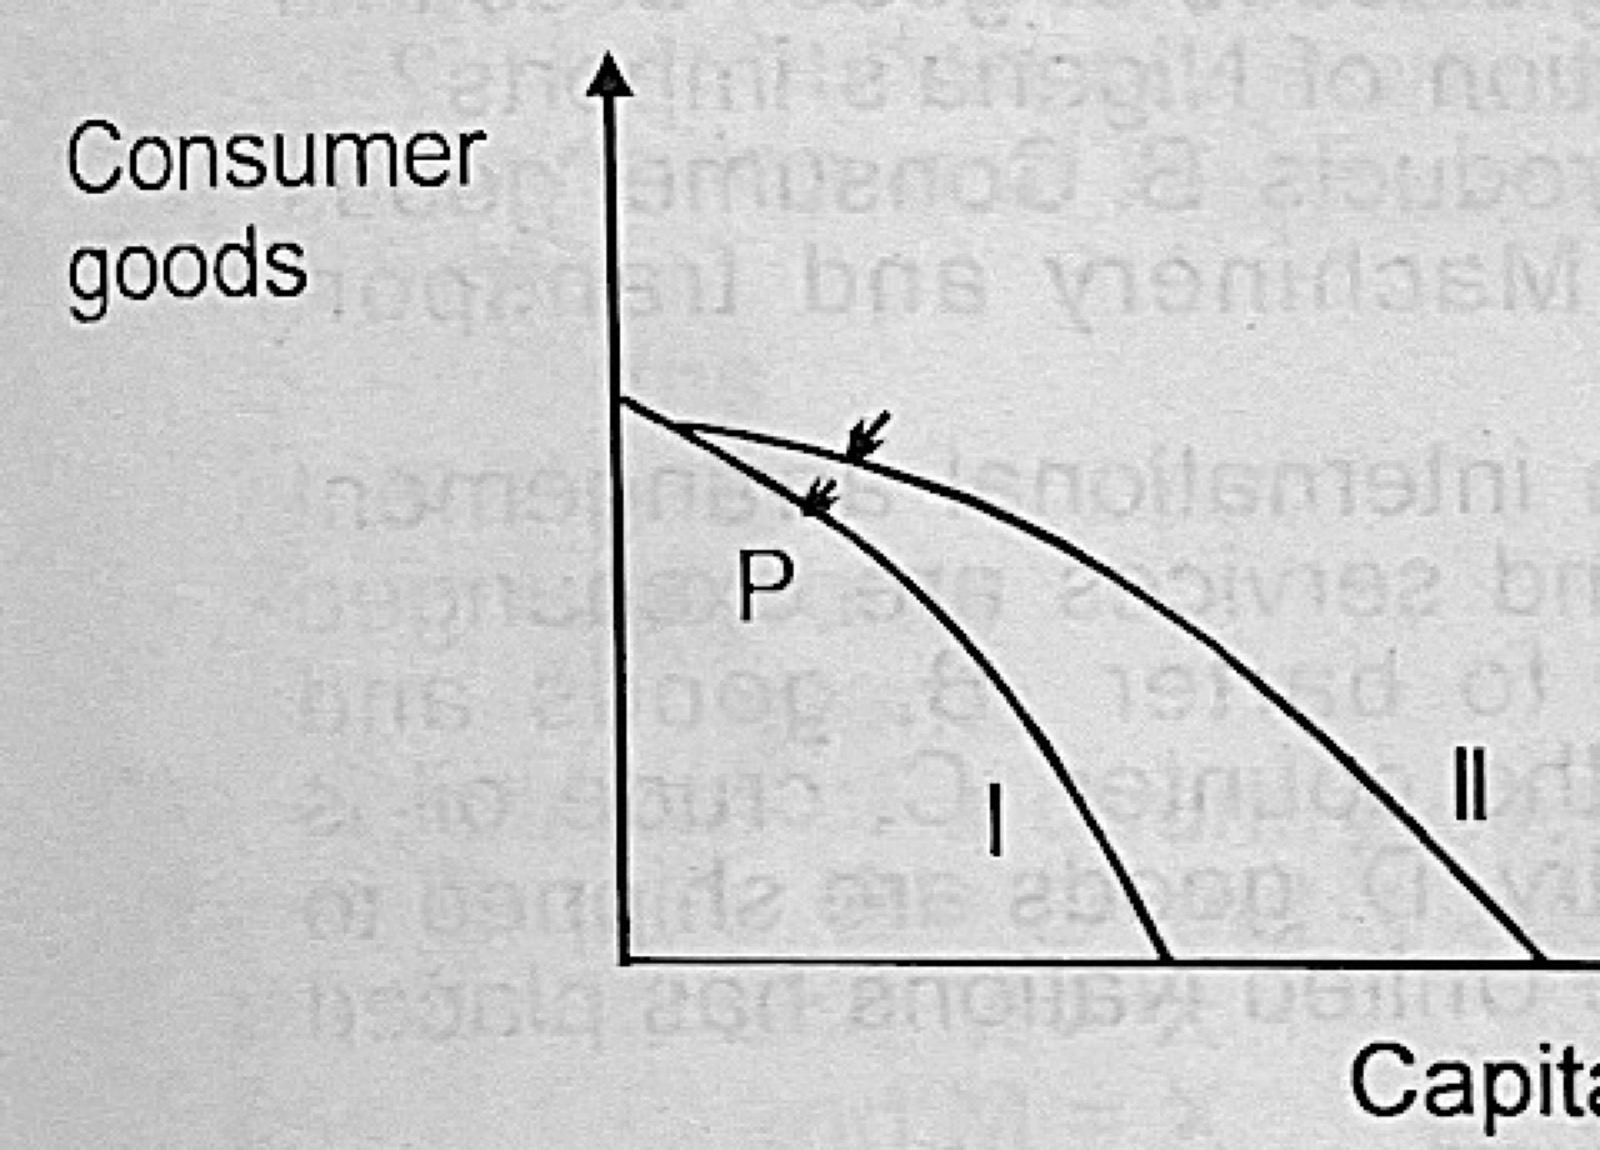
Use the diagram to answer the question. The current stage of the economy is depicted in curve I. Point P suggests that the economy is
A.reaching full employment but not full production
B.attaining full production but not full employment
C.under capitalized
D.attaining both full employment and full production.
Show the answer and explanation
Answer: D (attaining both full employment and full production.)
Explanation
Any point on a production possibility curve shows the economy using all its resources fully and efficiently; P is on curve I, so there is full employment and full production.
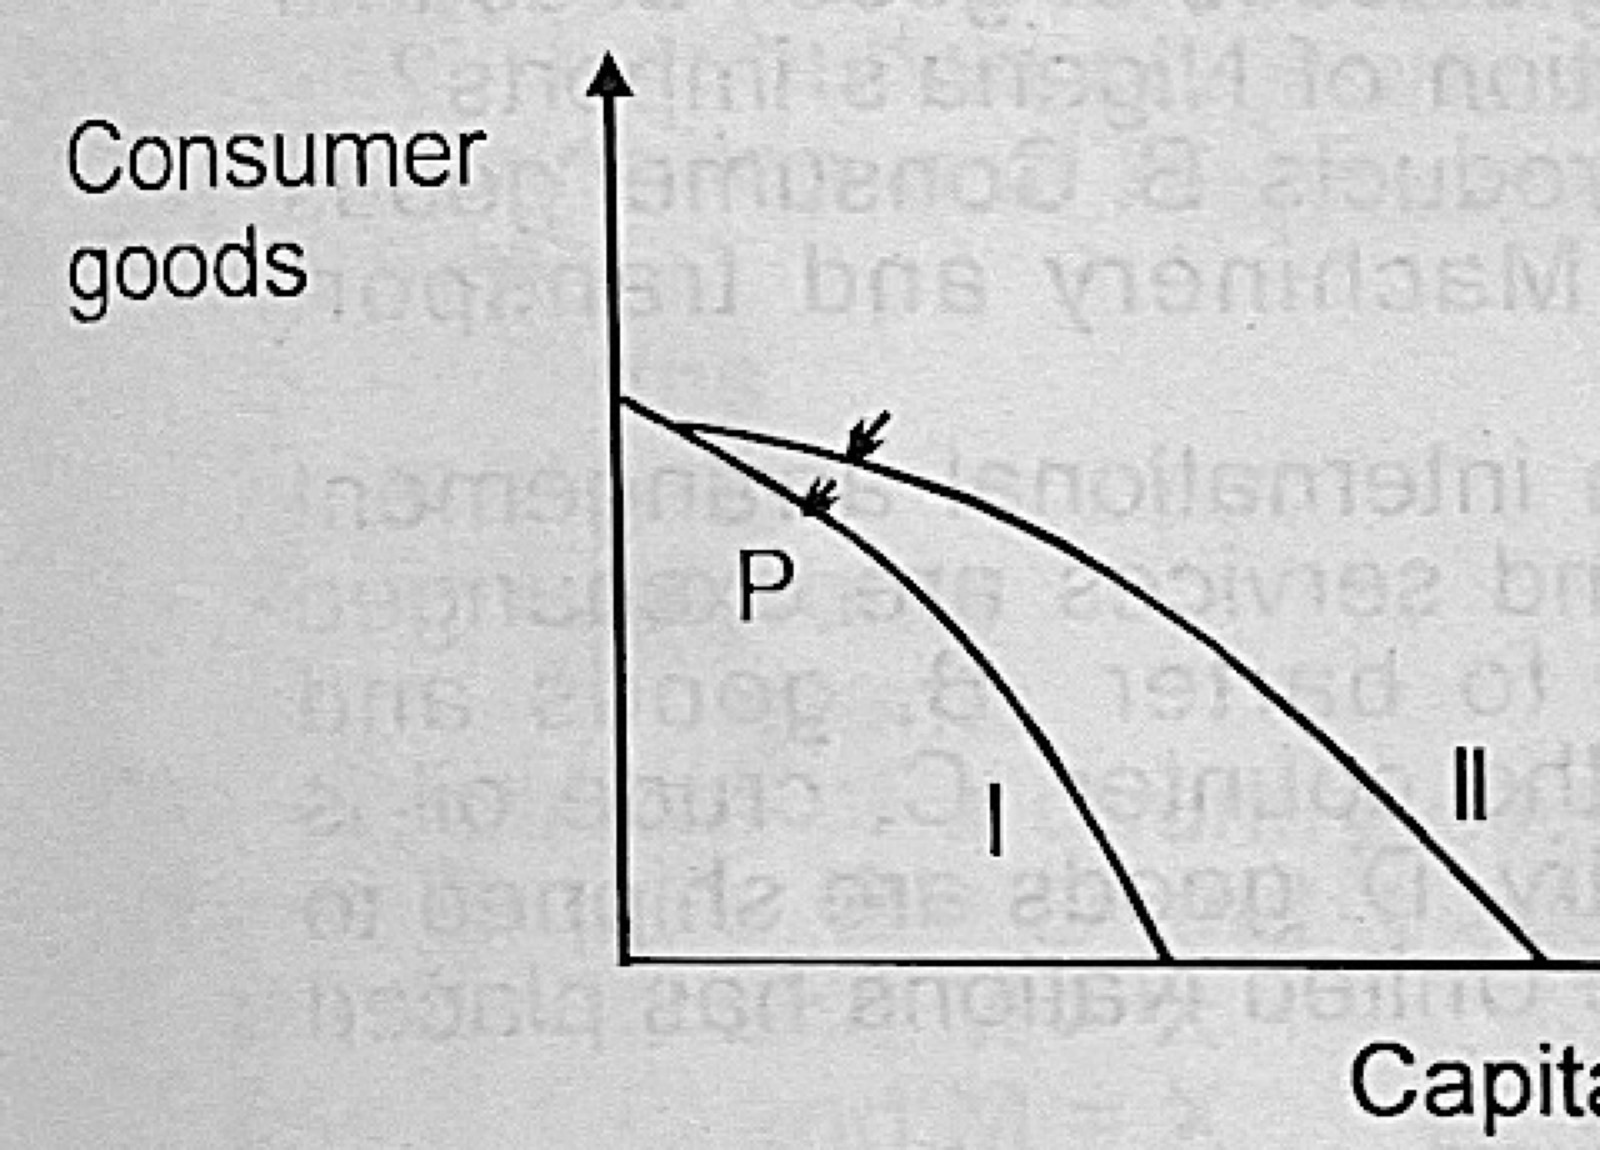
Use the diagram to answer the question. The current stage of the economy is depicted in curve I. The movement of curve I to II suggests
A.an improvement in capital goods technology but not in consumer goods technology
B.a movement from unemployment to full employment
C.that the output for the society has declined
D.a gain in consumer goods technique and not in capital goods technique.
Show the answer and explanation
Answer: A (an improvement in capital goods technology but not in consumer goods technology)
Explanation
Curve II starts at the same point on the consumer goods axis but reaches further along the capital goods axis, so only the capacity to produce capital goods has improved.
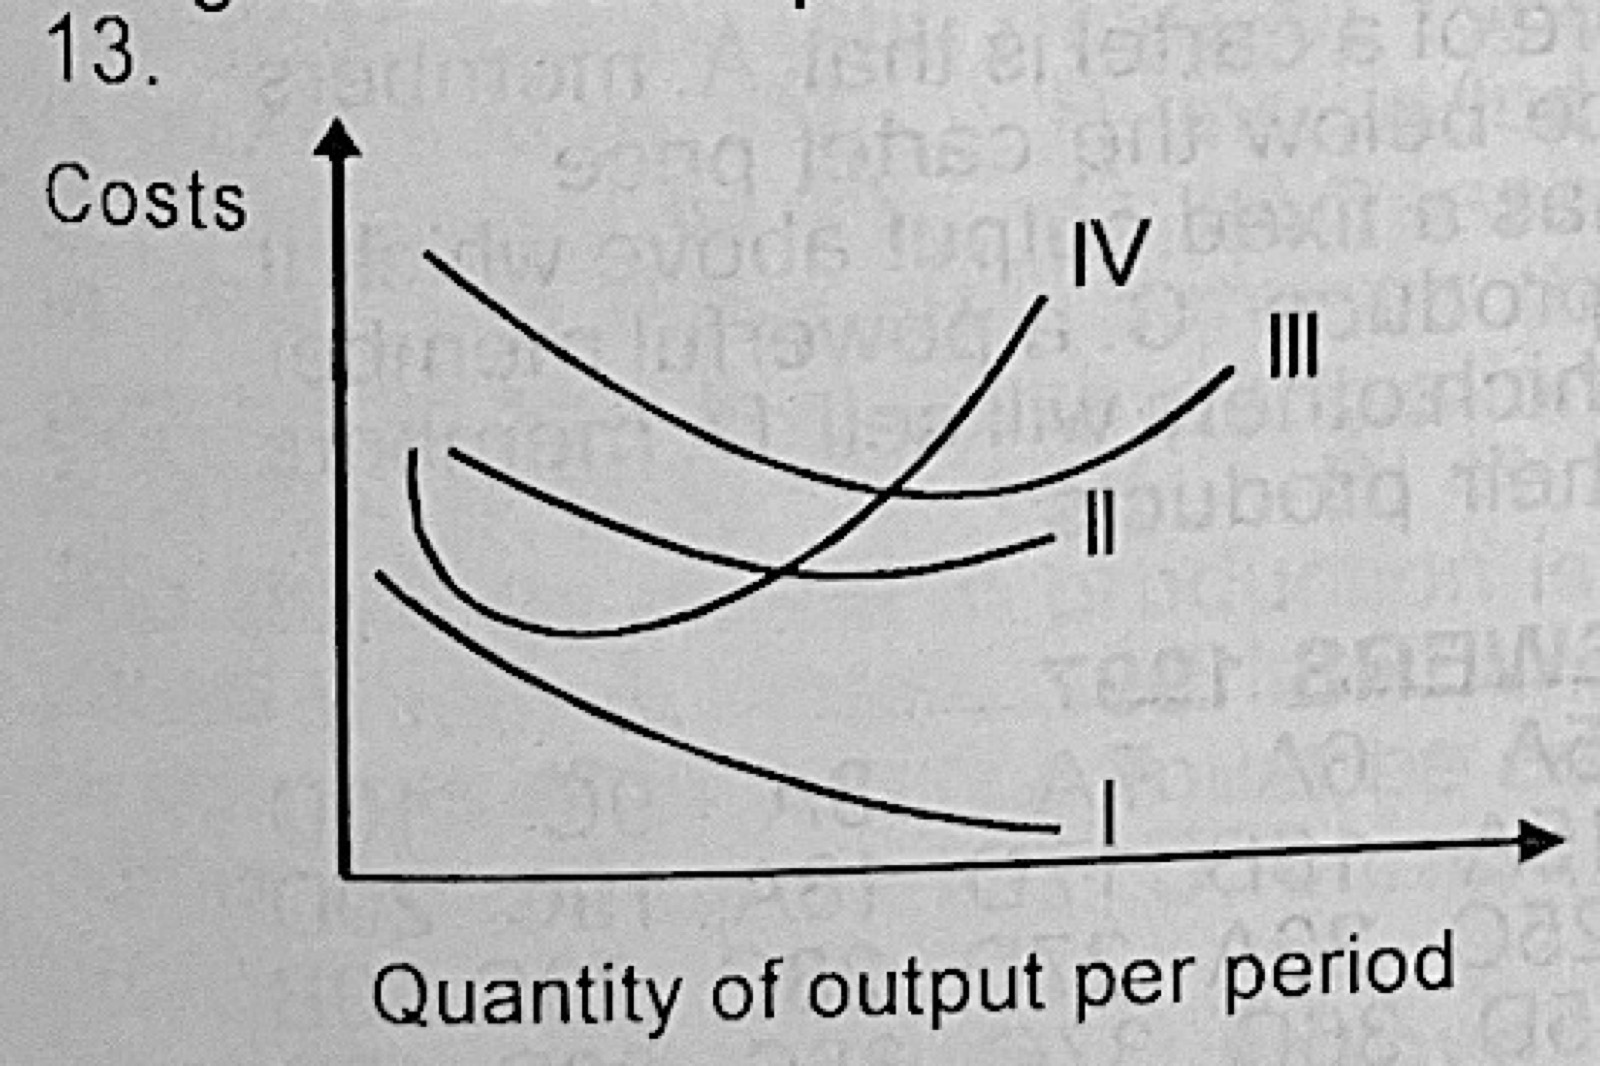
In the diagram above, the curve which represents the firm's short-run average variable cost is curve
A.I
B.II
C.III
D.IV.
Show the answer and explanation
Answer: B (II)
Explanation
I keeps falling, so it is average fixed cost; IV is the steep marginal cost curve; III is average total cost. The lower U-shaped curve II, cut by MC at its lowest point before ATC, is average variable cost.
If the percentage change in the income of the consumers of an industrial product is less than the resulting percentage change in the quantity demanded of the product, then the income elasticity of demand for the product is
A.less than one
B.equal to one
C.greater than one
D.equal to zero.
Show the answer and explanation
Answer: C (greater than one)
Explanation
Income elasticity = % change in quantity demanded ÷ % change in income. If quantity changes by a bigger percentage than income, the result is greater than one.
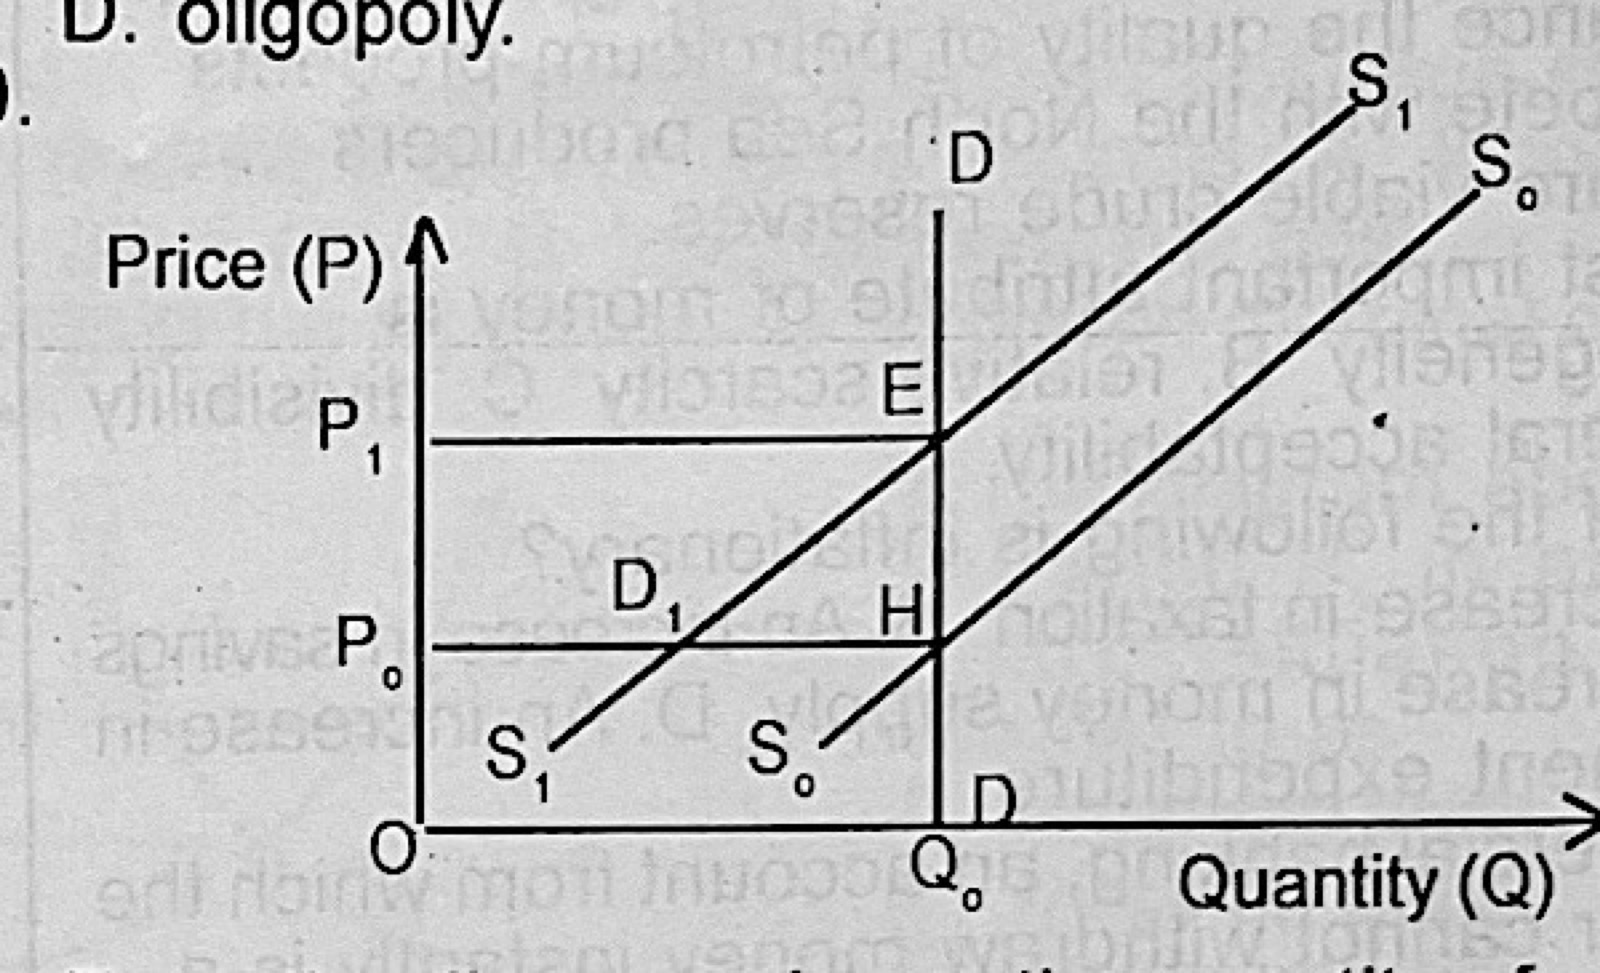
From the diagram above, the quantity of output is determined by the point
A.M
B.N
C.H
D.F.
Show the answer and explanation
Answer: C (H)
Explanation
Equilibrium output is where the demand curve DD meets the supply curve S0, at point H, giving quantity Q0. Demand is vertical, so output stays at Q0 even when supply shifts.
The suggestion that peasants in Africa have backward-bending supply curves of output implies that their response to an increase in the price of their crops will be to
A.increase their output
B.decrease their output
C.keep their output constant
D.hoard their output.
Show the answer and explanation
Answer: B (decrease their output)
Explanation
A backward-bending supply curve means that after a point, a higher price leads to less being supplied, since peasants can reach their income target by selling less.
The greatest proportion of government revenue in Nigeria comes from
A.export of raw materials
B.income taxes on individuals and businesses
C.customs and excise taxes
D.loans and grants from industrially advanced countries.
Show the answer and explanation
Answer: A (export of raw materials)
Explanation
Since the 1970s crude oil, exported mostly unprocessed, has provided the greatest share of Nigerian government revenue through oil sales, royalties and petroleum profits tax.
If the marginal propensity to consume is 0.75 and private investment increases by ₦10 billion while government expenditure decreases by ₦15 billion, GDP will decrease by
A.₦12 billion
B.₦15 billion
C.₦20 billion
D.₦25 billion.
Show the answer and explanation
Answer: C (₦20 billion)
Explanation
Multiplier = 1 ÷ (1 − 0.75) = 4. Net change in spending = +10 − 15 = −₦5 billion. GDP change = 4 × (−5) = −₦20 billion.
Given: Investment = ₦100 million Consumption = ₦200m + 0.75Y Y = C + I where, Y = Income, C = Consumption and I = Investment. What is the income level to the nearest million?
A.₦100 million
B.₦300 million
C.₦1,000 million
D.₦1,200 million.
Show the answer and explanation
Answer: D (₦1,200 million.)
Explanation
Y = 200 + 0.75Y + 100, so 0.25Y = 300 and Y = ₦1,200 million.
In recent years, Nigeria's balance of payments has continued to register a deficit due to I: increased government overseas' spending II. increasing prices of exports III. rising import prices IV. more payments to overseas' investors.
A.I, II and III
B.I, II and IV
C.I, III and IV
D.II, III and IV.
Show the answer and explanation
Answer: C (I, III and IV)
Explanation
Overseas spending, dearer imports and payments to foreign investors all send money out. Rising export prices bring money in, so II does not cause a deficit.
The organization which provides credit to help countries achieve short-term balance in their balance of payments is the
A.Economic Community of West African States
B.International Monetary Fund
C.International Bank for Reconstruction and Development
D.African Development Bank.
Show the answer and explanation
Answer: B (International Monetary Fund)
Explanation
The IMF lends to member countries to help them correct short-term balance of payments problems; the World Bank (IBRD) gives long-term development loans.