Question 11
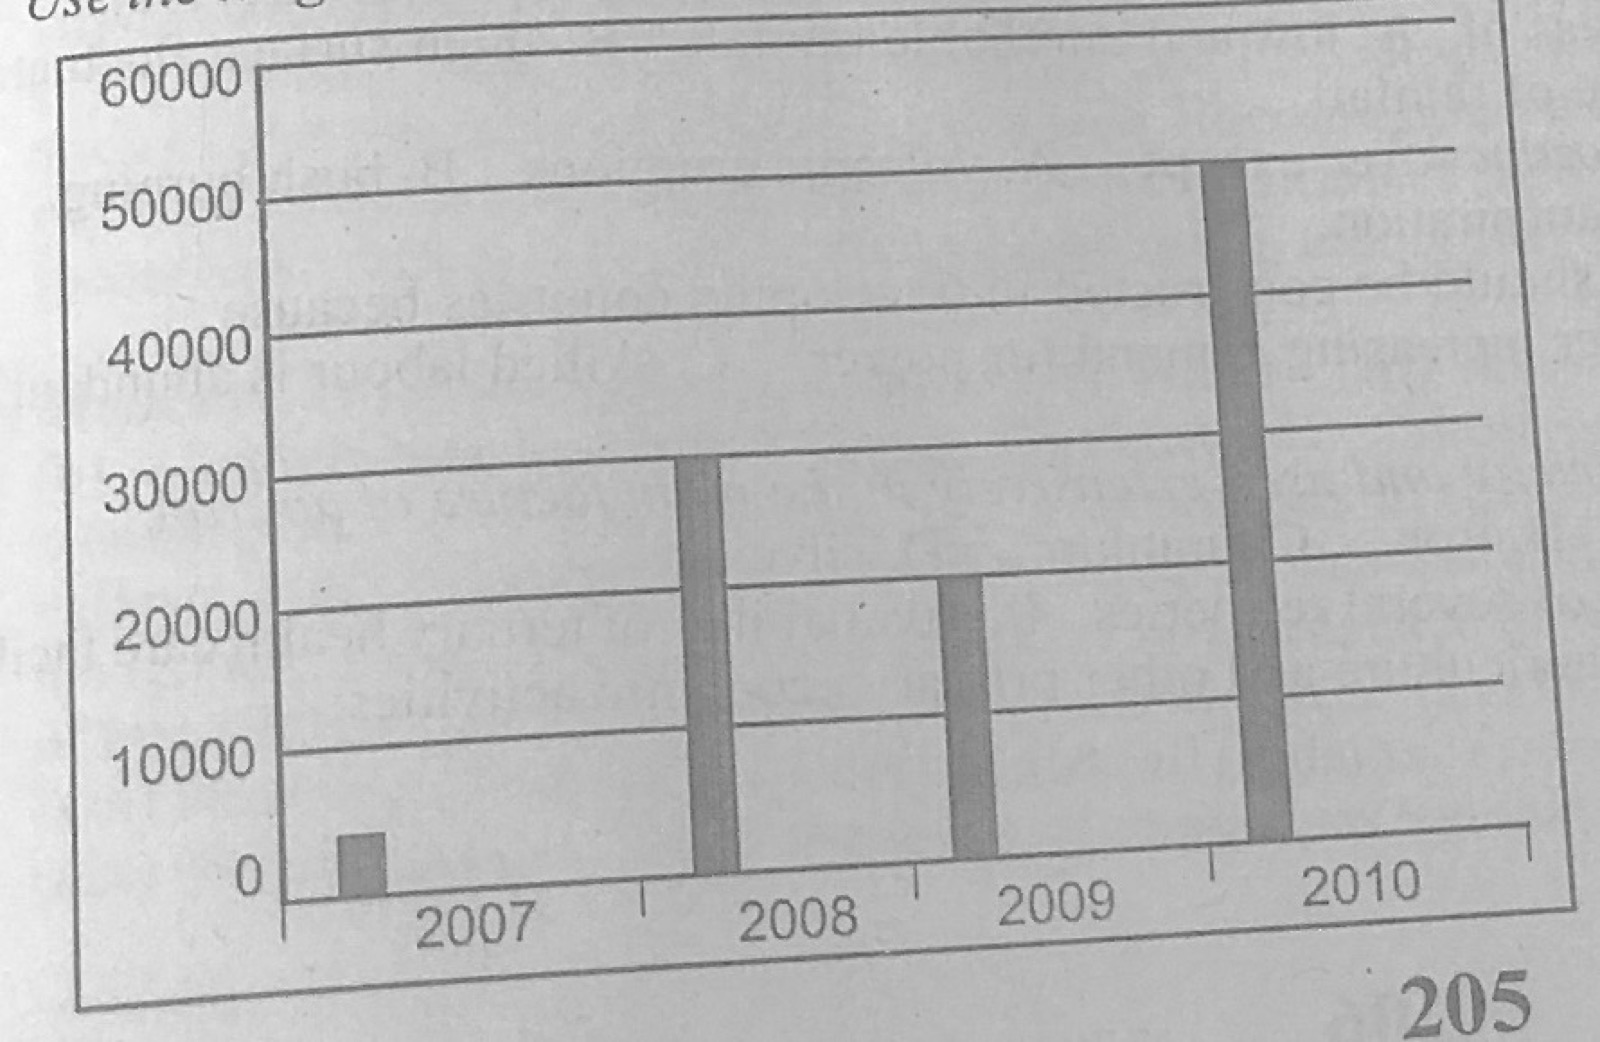
Statistical Maps and DiagramsThe diagram represents the export of rice in kilogrammes from Country X between 2007 and 2010. Use it to answer this question. What is the name of the diagram above?
- A.Line graph
- B.Bar graph
- C.Pie chart
- D.Star graph
Show the answer and explanation
Answer: B (Bar graph)
Explanation
Values are shown by the heights of separate bars.