Question 12
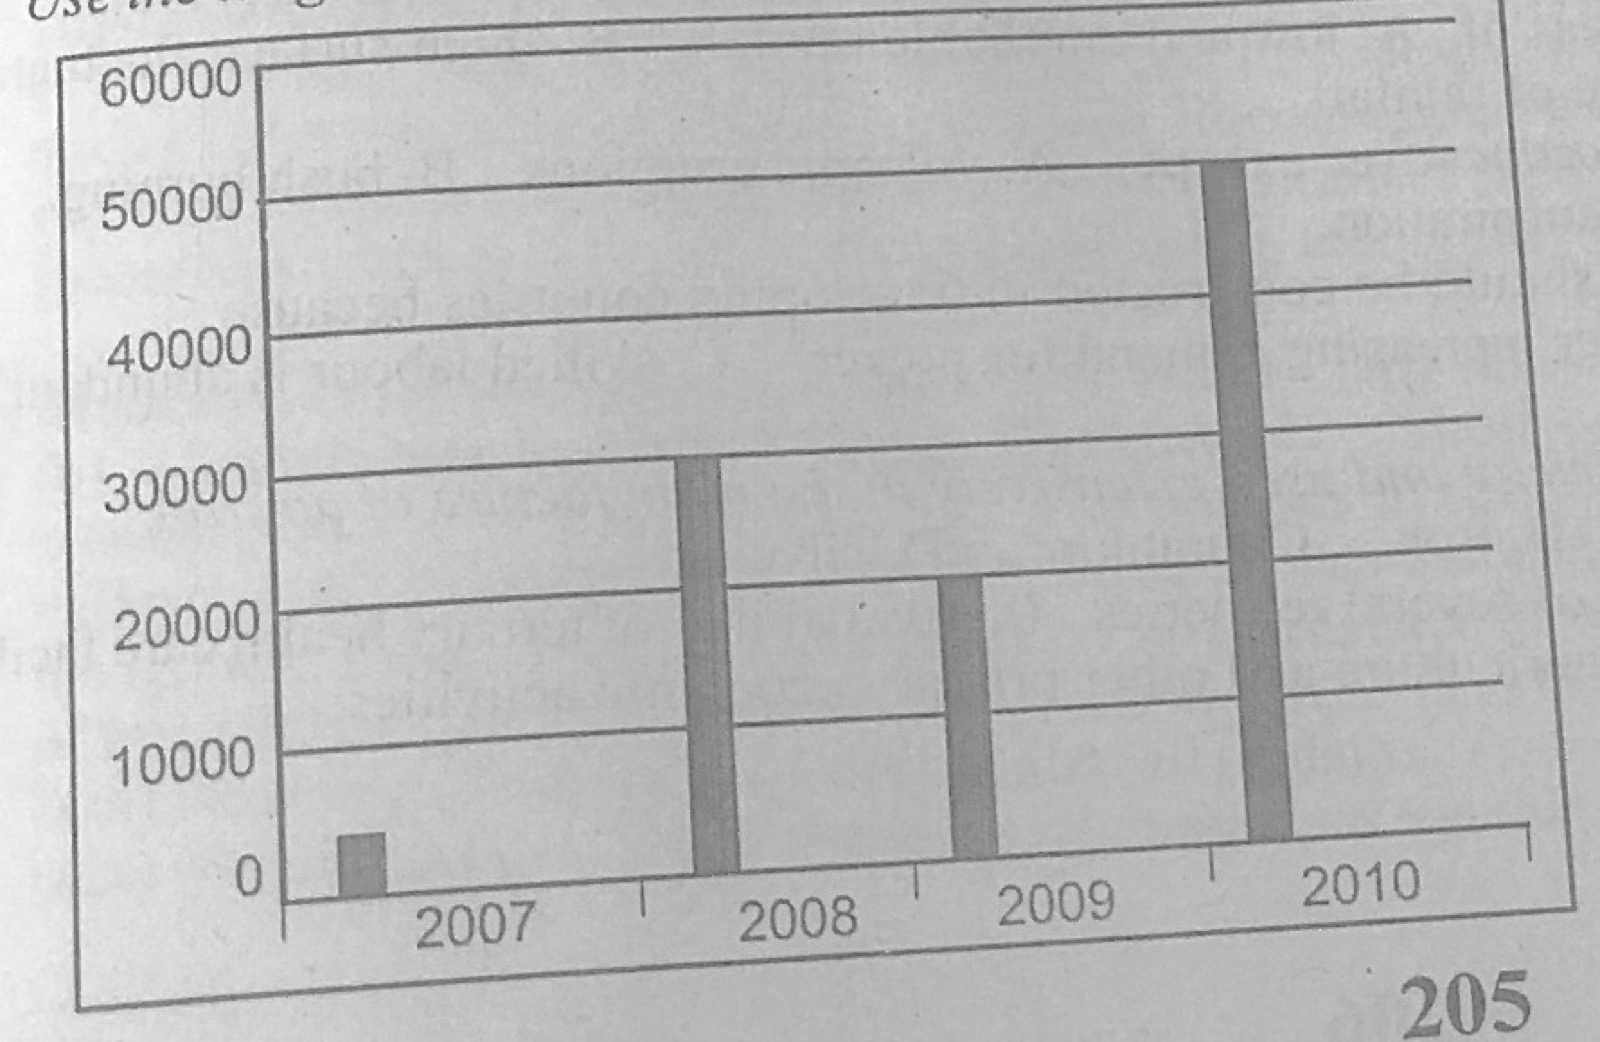
Statistical Maps and DiagramsThe diagram represents the export of rice in kilogrammes from Country X between 2007 and 2010. Use it to answer this question. How much rice was produced in 2010 by Country X?
- A.10,000 kilogrammes.
- B.20,000 kilogrammes.
- C.50,000 kilogrammes.
- D.60,000 kilogrammes.
Show the answer and explanation
Answer: C (50,000 kilogrammes.)
Explanation
The 2010 bar reaches about the 50,000 line.