Question 4
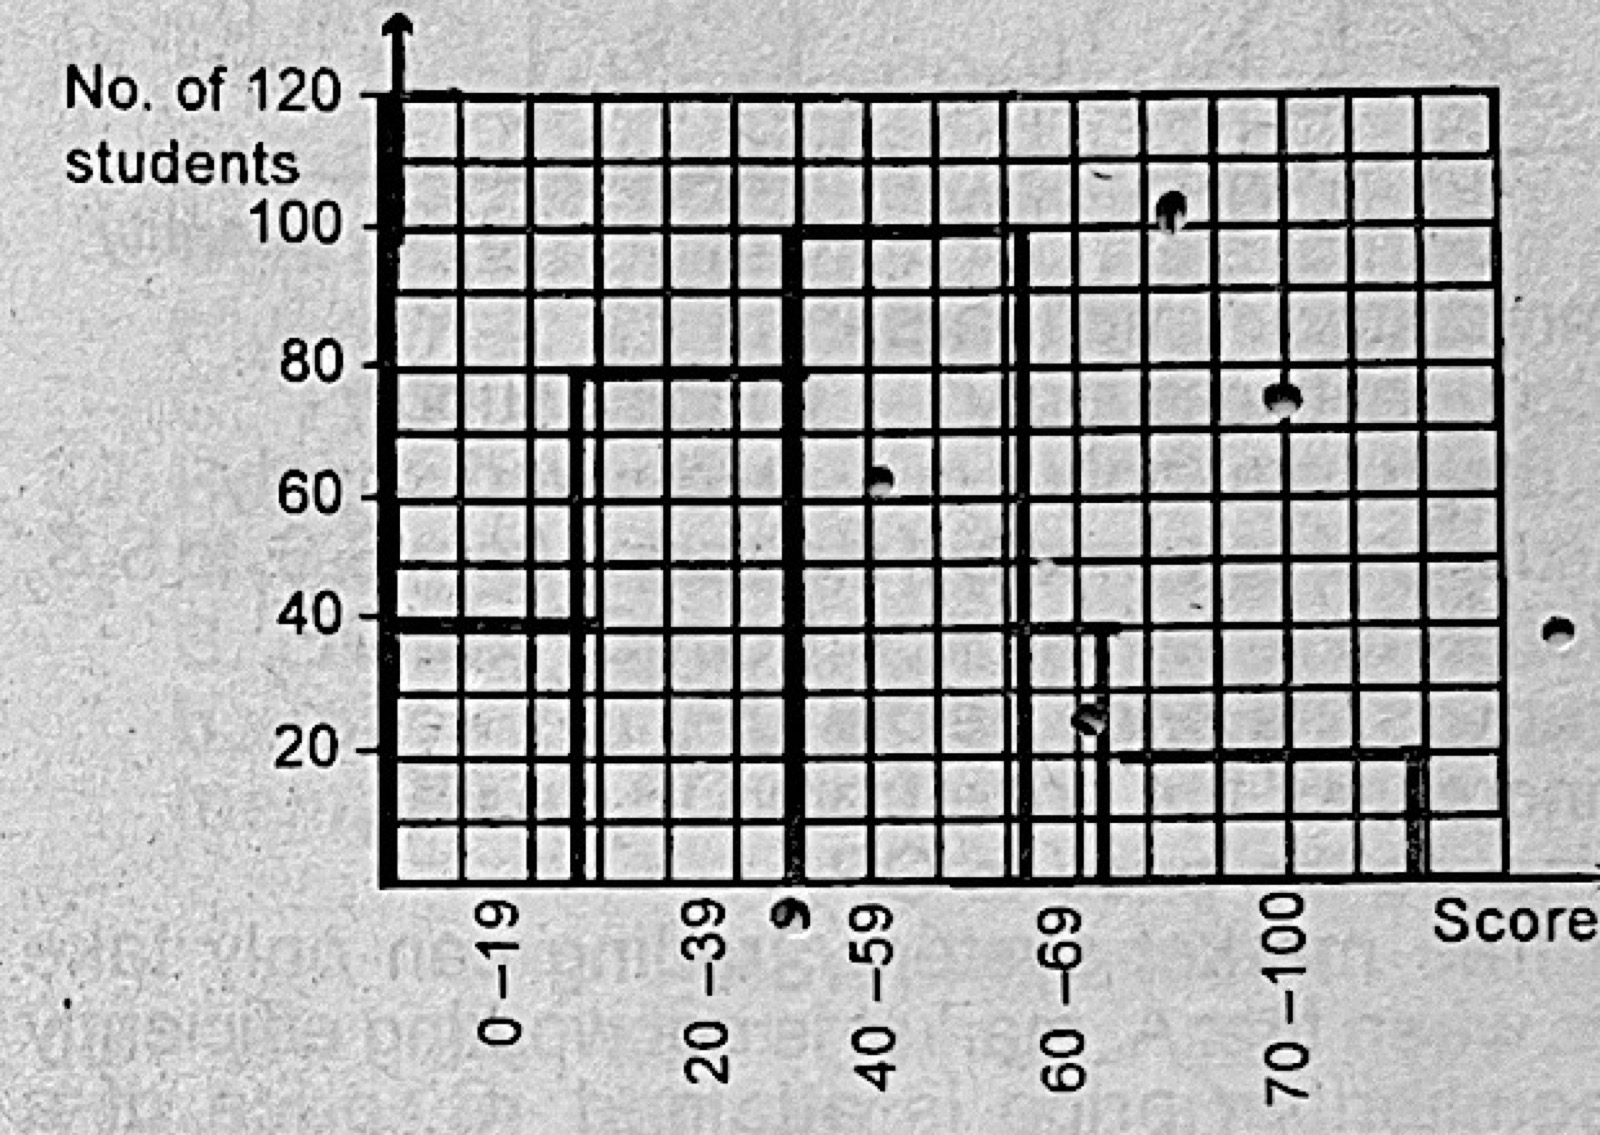
Tools of Economic AnalysisUse the histogram to answer the question (scores on the horizontal axis, number of students on the vertical axis).
If the pass mark was 40, how many students passed the examination?
- A.100
- B.120
- C.160
- D.200.
Show the answer and explanation
Answer: C (160)
Explanation
Students scoring 40 and above: 100 (40–59) + 40 (60–69) + 20 (70–100) = 160.