Question 3
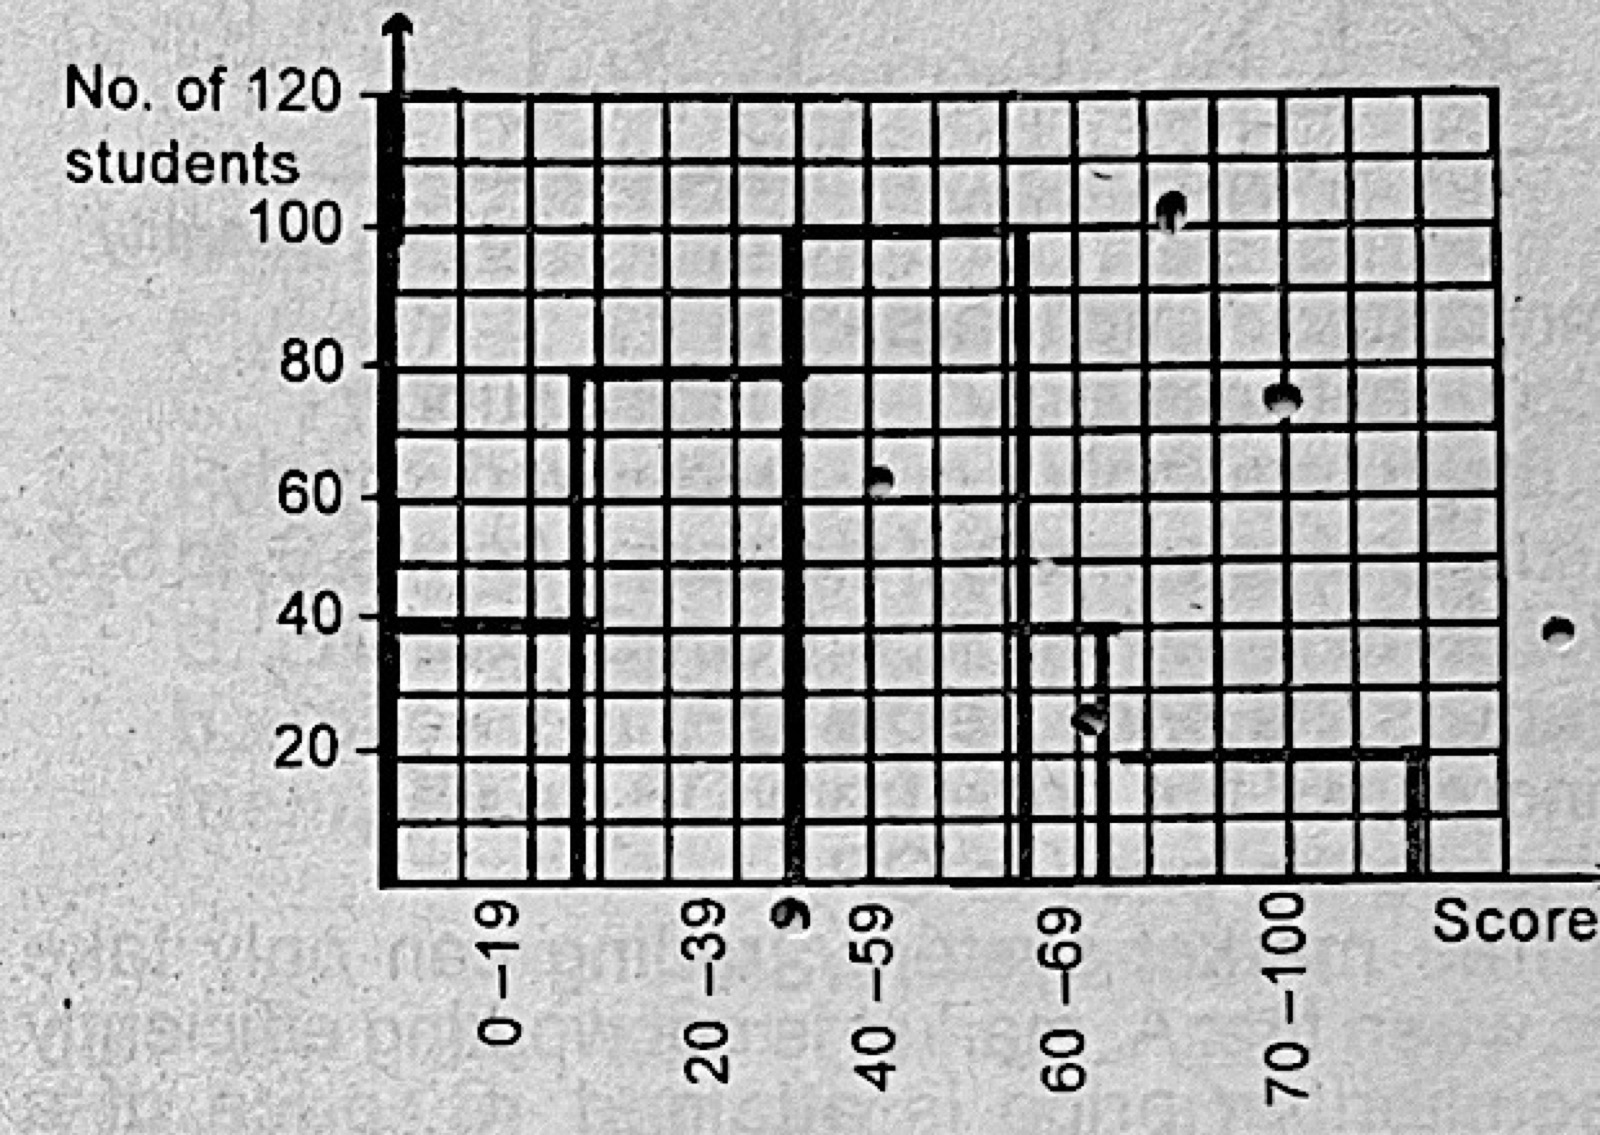
Tools of Economic AnalysisUse the histogram to answer the question (scores on the horizontal axis, number of students on the vertical axis).
How many students took the examination?
- A.280
- B.240
- C.200
- D.80.
Show the answer and explanation
Answer: A (280)
Explanation
Add the bar heights: 40 (0–19) + 80 (20–39) + 100 (40–59) + 40 (60–69) + 20 (70–100) = 280.