Question 47
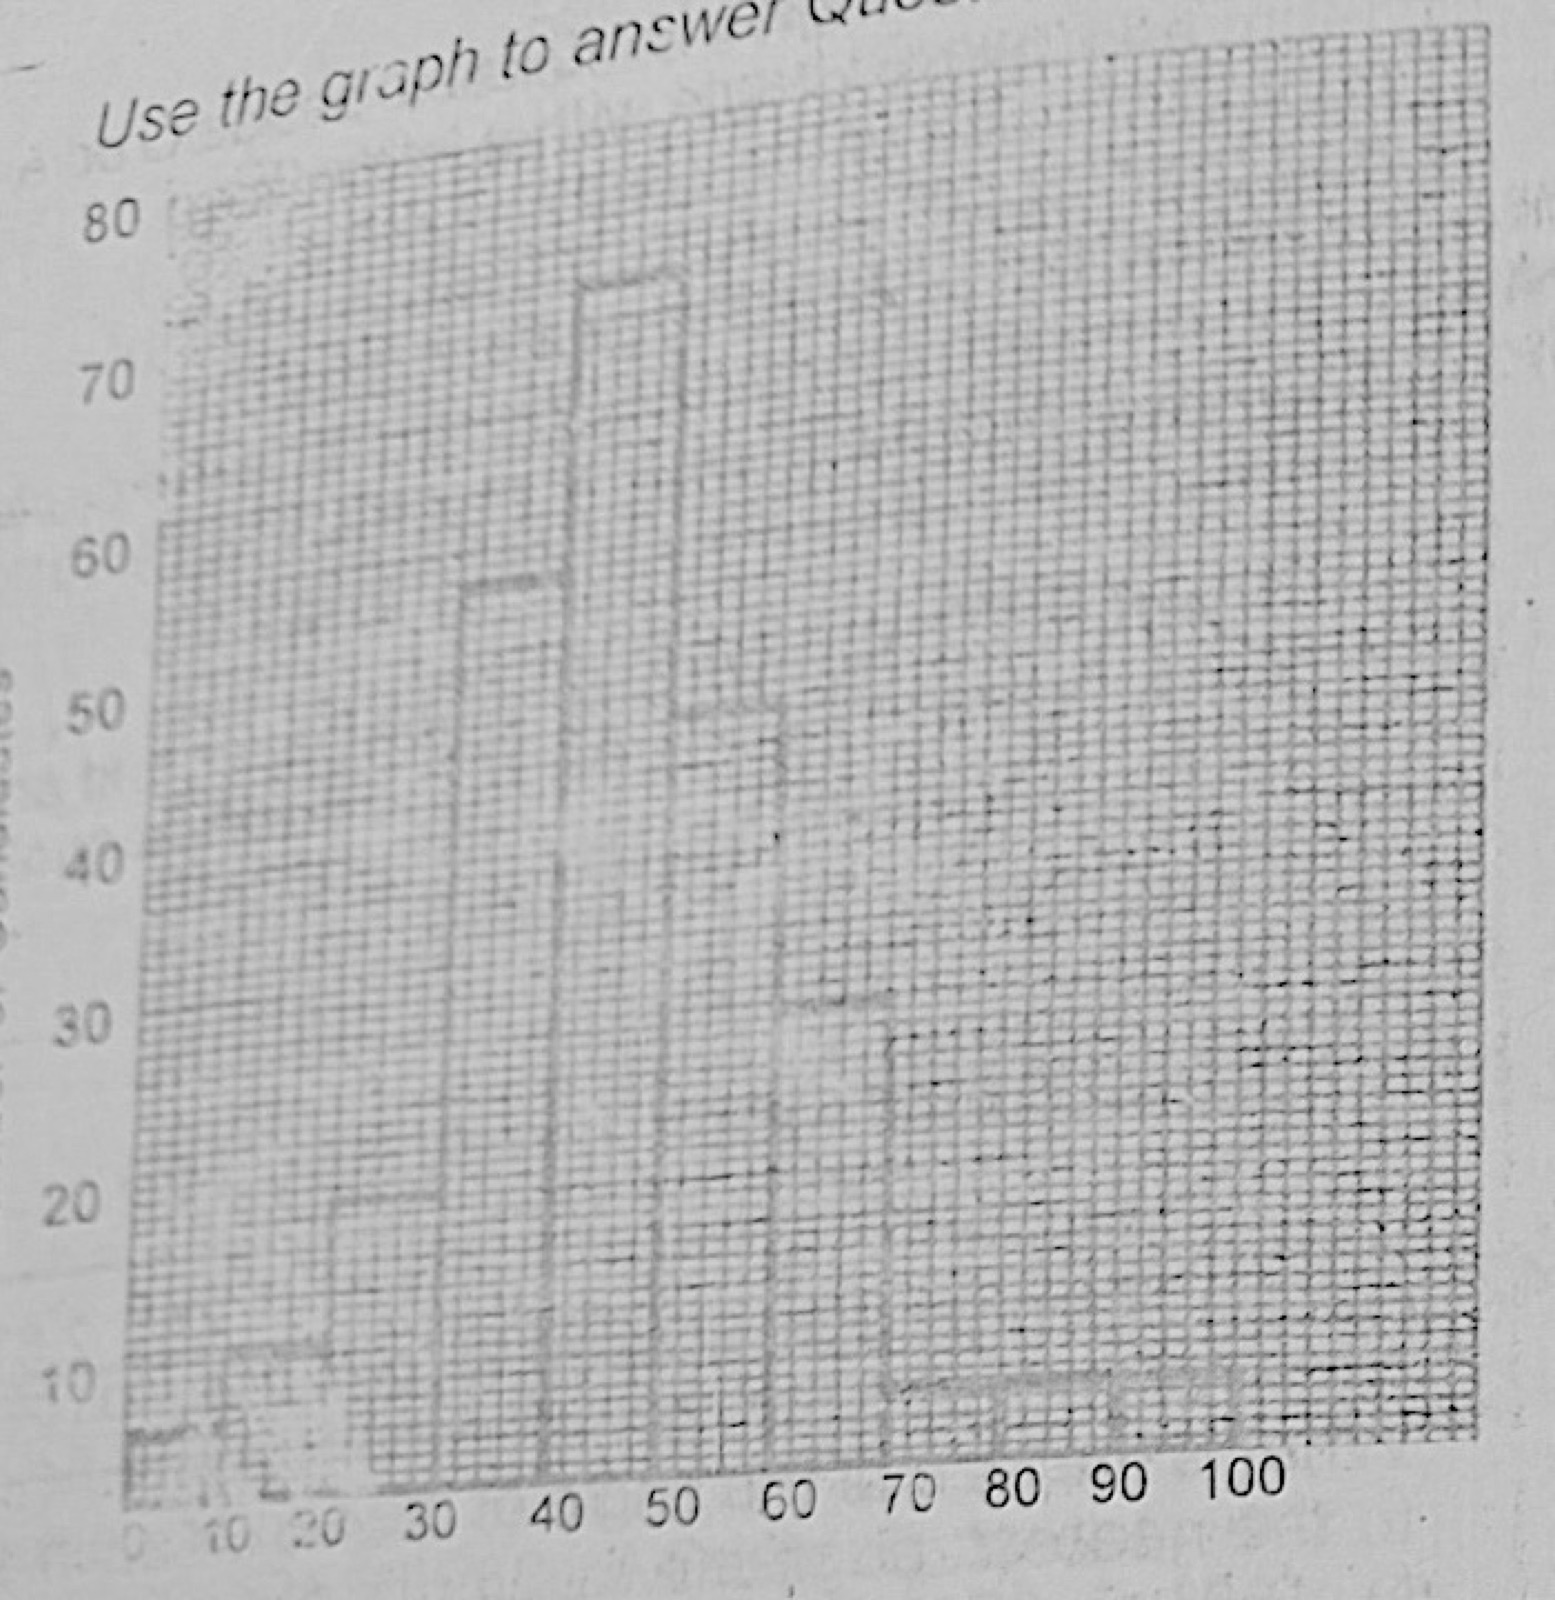
Data PresentationThe histogram shows the number of candidates, in thousands, obtaining given ranges of marks in a State Examination. How many candidates scored at most 30%?
- A.15,000
- B.20,000
- C.25,000
- D.35,000
- E.60,000
Show the answer and explanation
Answer: D (35,000)
Explanation
Add the bars for 0–10, 10–20 and 20–30: 5 + 10 + 20 = 35 thousand.