Question 46
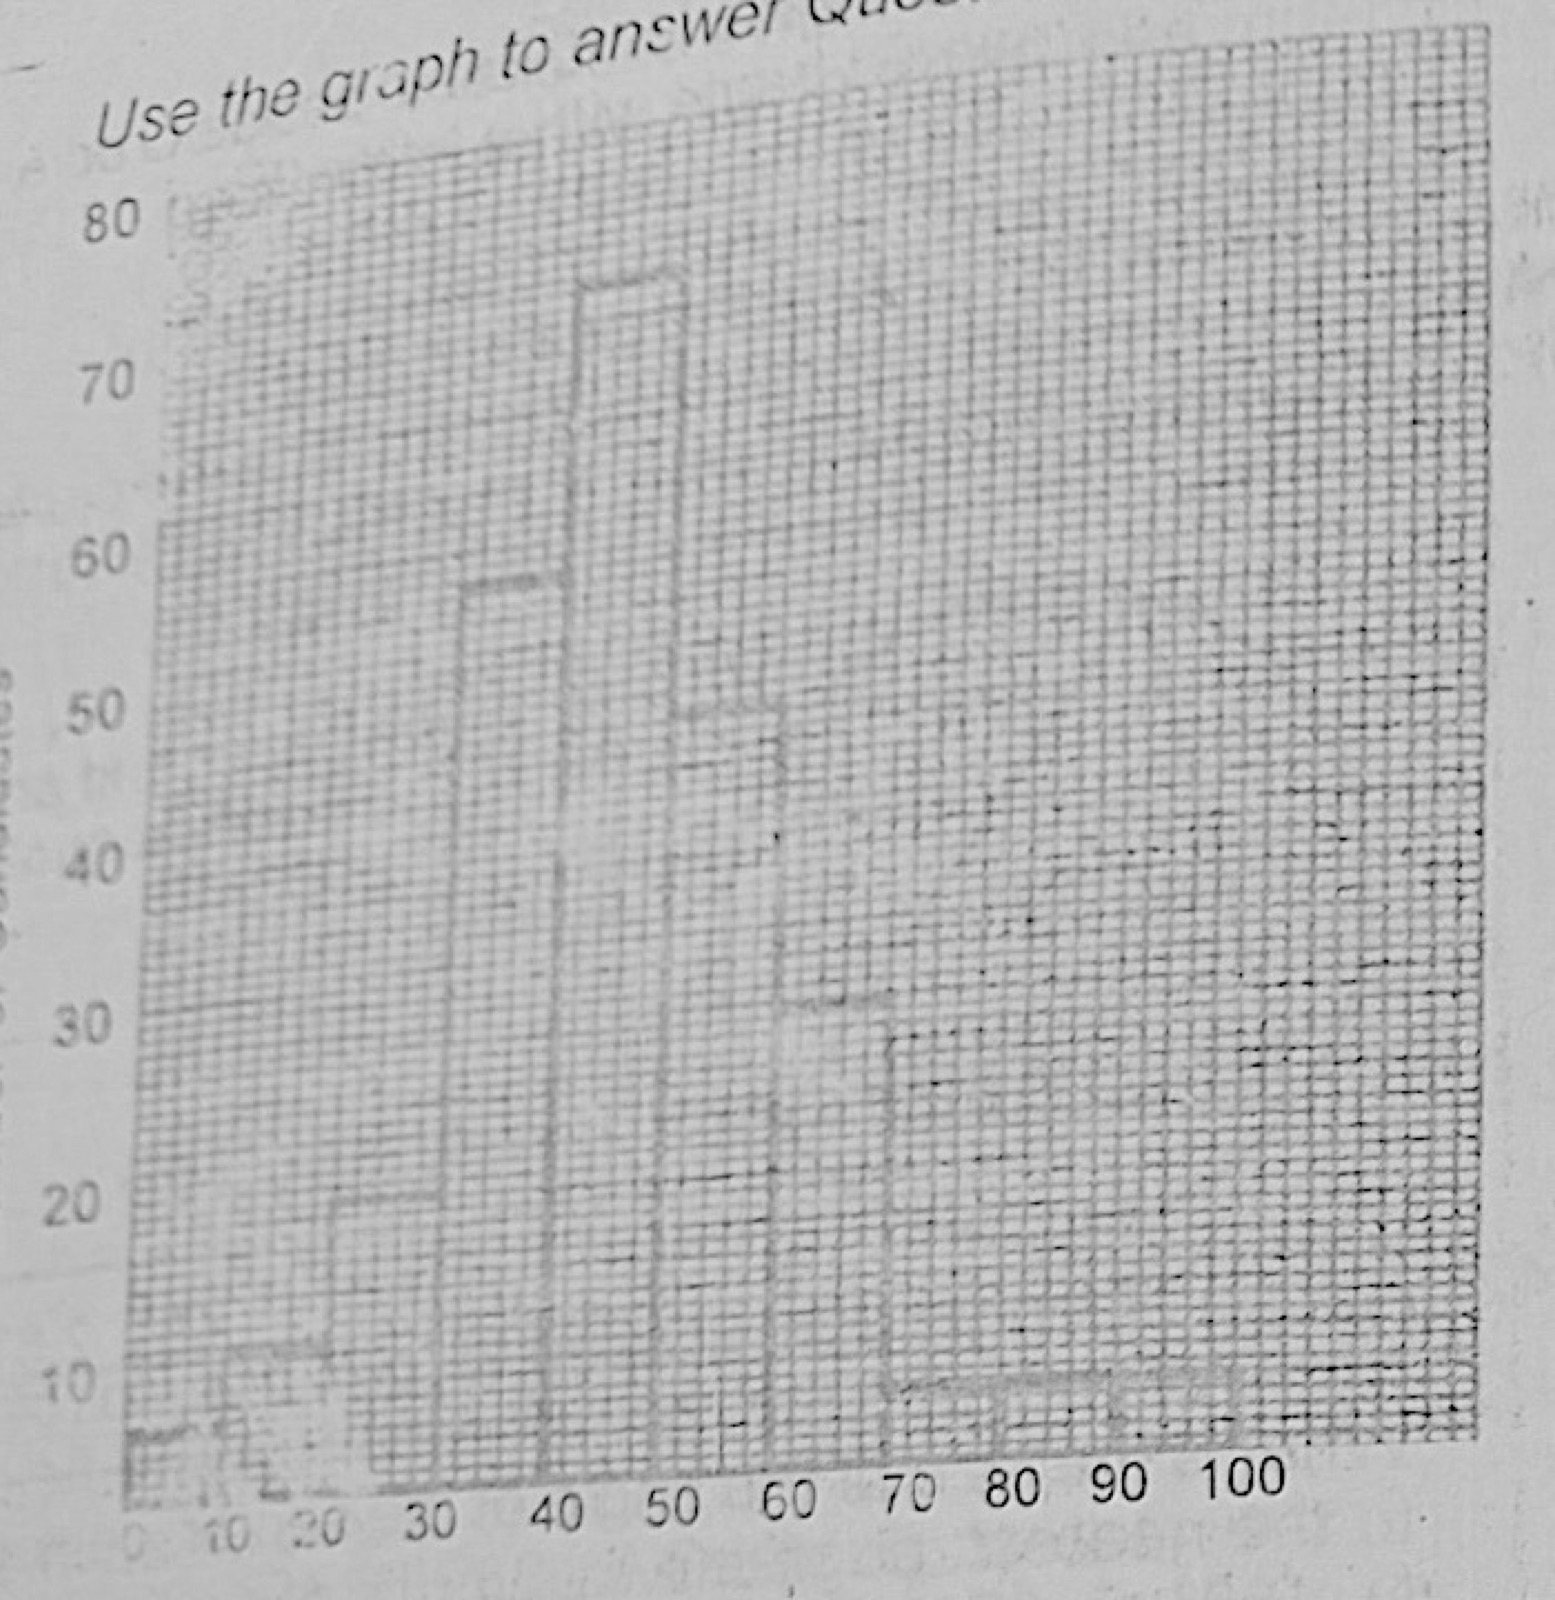
Data PresentationThe histogram shows the number of candidates, in thousands, obtaining given ranges of marks in a State Examination. Find the total number of candidates that sat for the examination
- A.80,000
- B.120,000
- C.250,000
- D.260,000
- E.270,000.
Show the answer and explanation
Answer: E (270,000.)
Explanation
Add the heights of all the bars (in thousands): roughly 5 + 10 + 20 + 57 + 75 + 50 + 30 + 7 + 7 + 7 ≈ 270, i.e. about 270,000 candidates.