Question 12
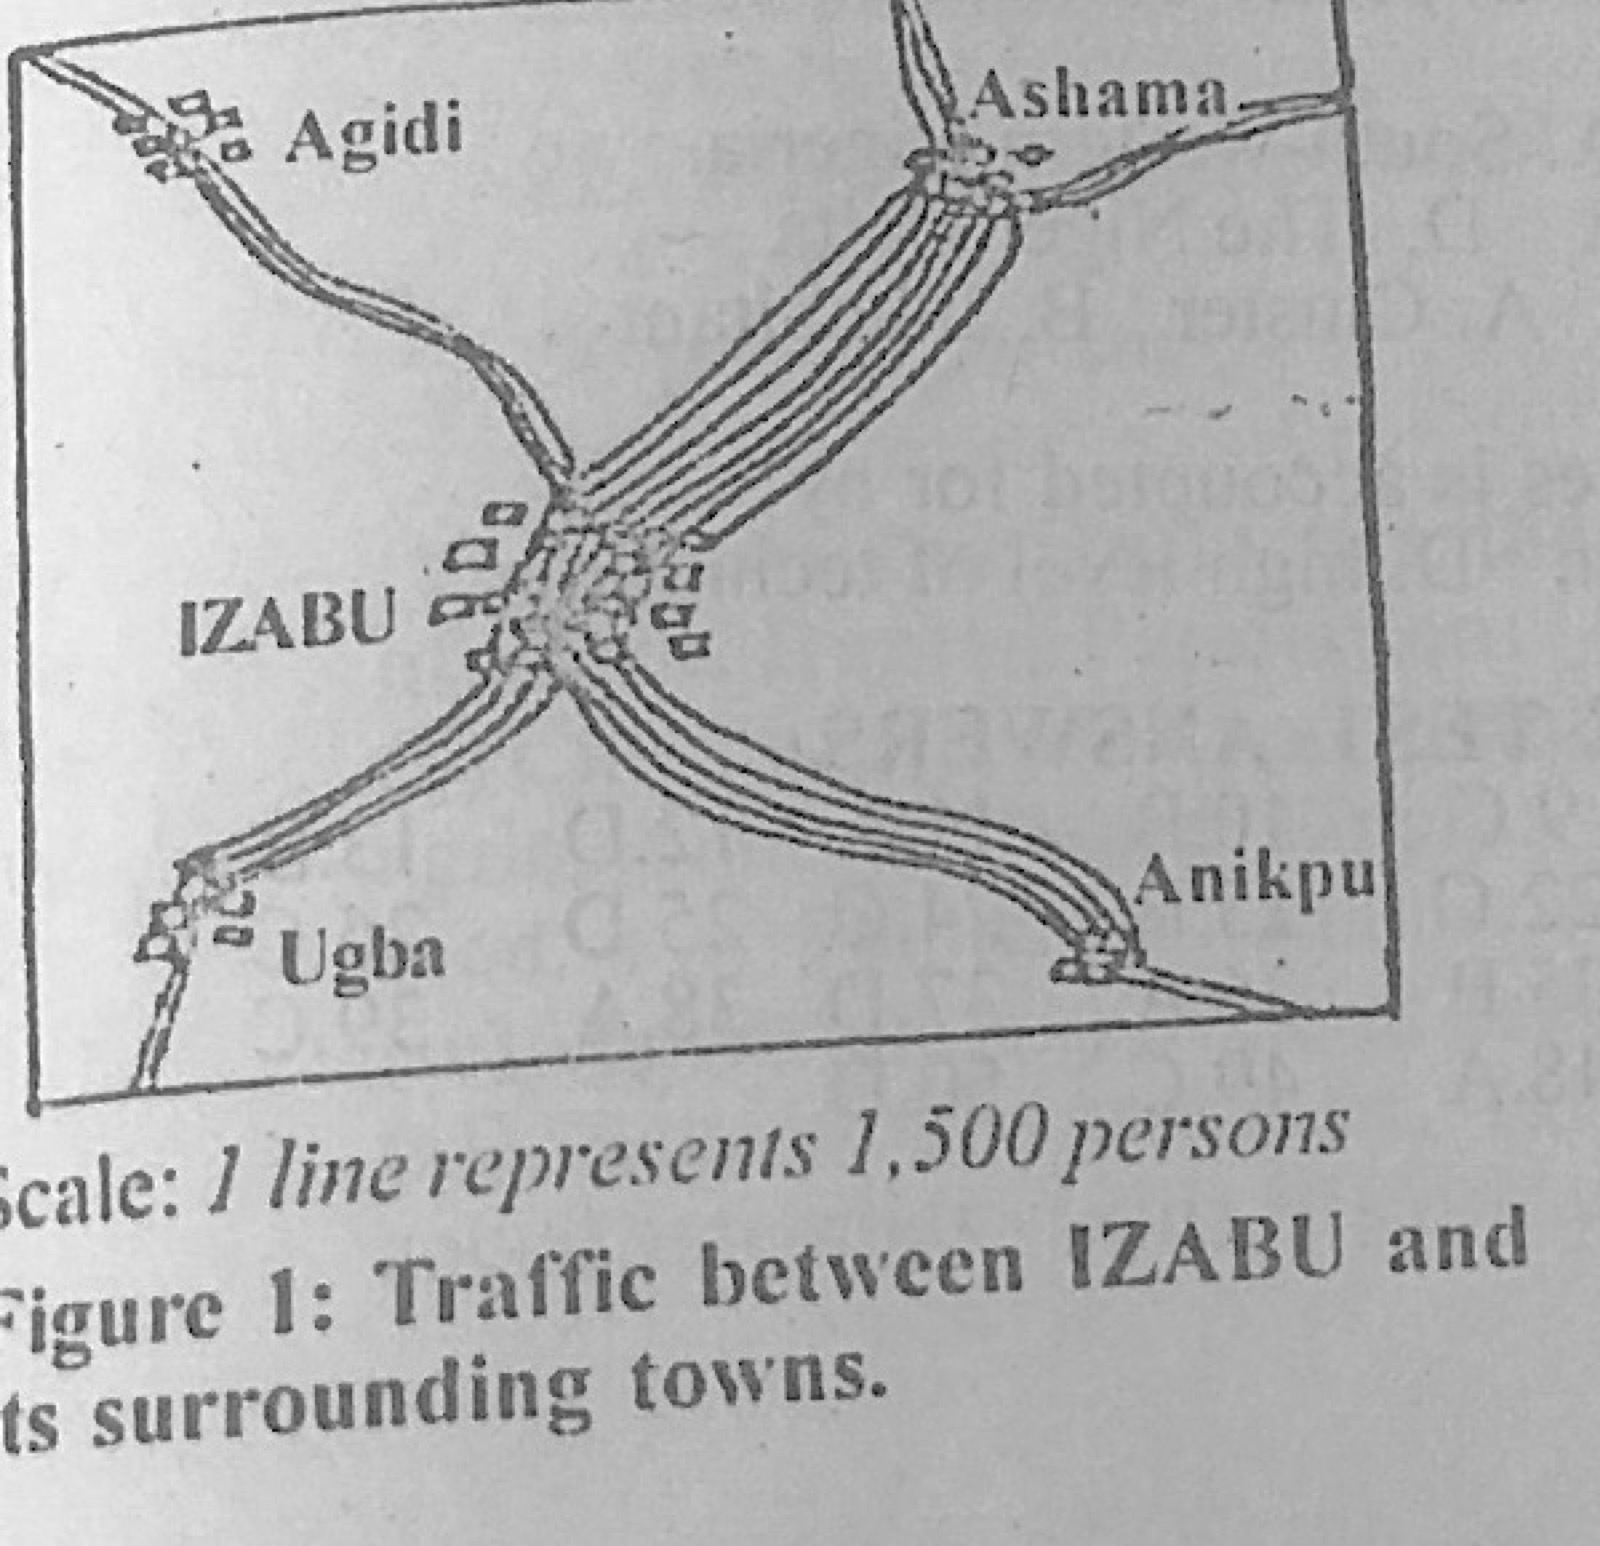
Statistical Maps and DiagramsFigure 1 shows the volume and direction of passenger traffic between IZABU town and its surrounding towns in the year 2001 (scale: 1 line represents 1,500 persons). Use it to answer this question. How many passengers travelled between IZABU and Ashama?
- A.6,000
- B.8,000
- C.10,000
- D.12,000
Show the answer and explanation
Answer: D (12,000)
Explanation
The IZABU-Ashama band has 8 lines: 8 × 1,500 = 12,000.