Question 37
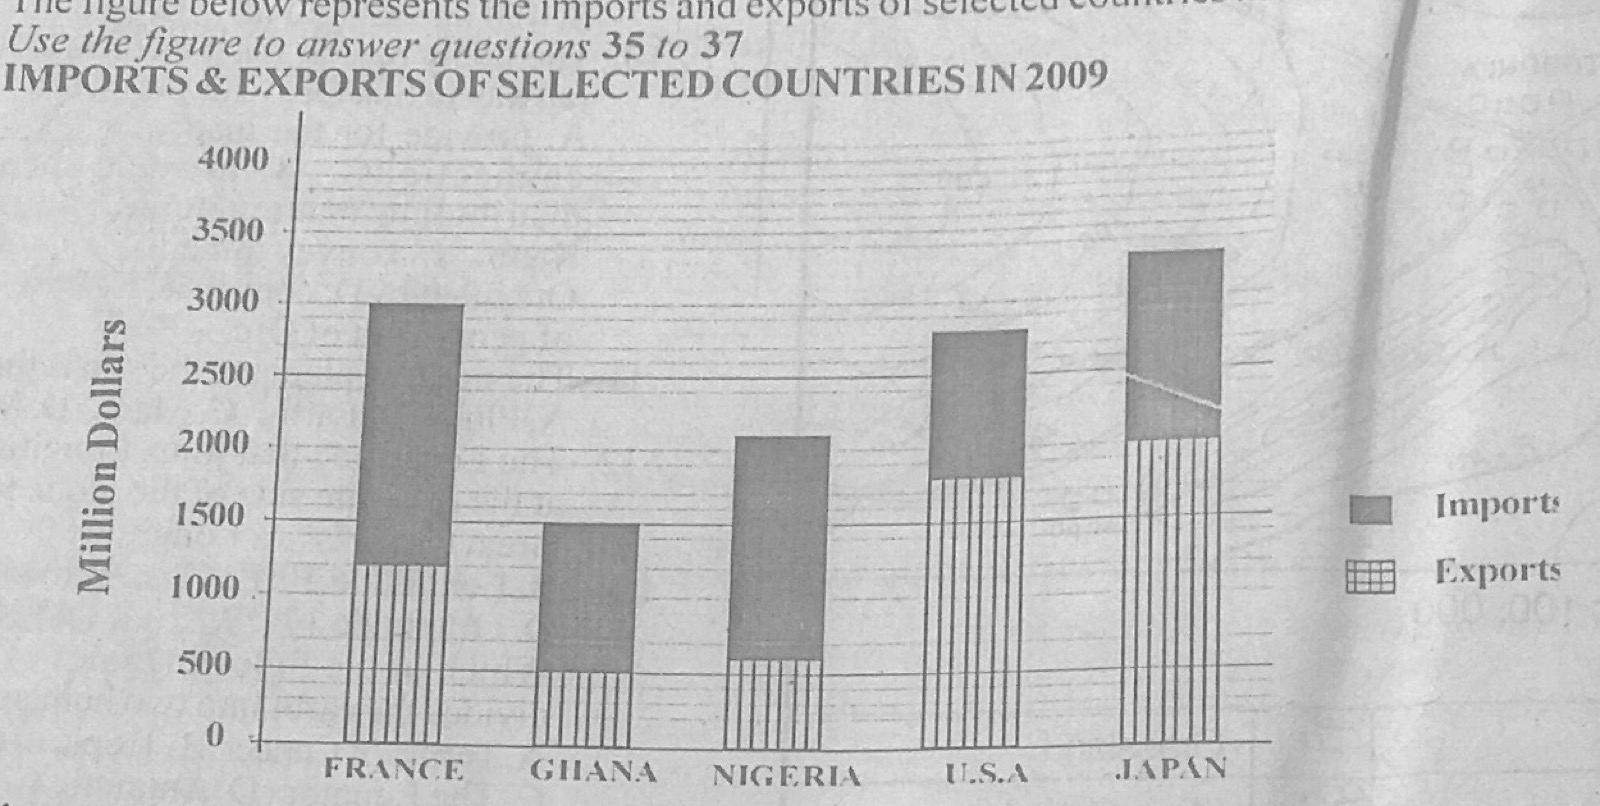
Statistical Maps and DiagramsThe figure (Imports & exports of selected countries in 2009, in million dollars) represents the imports and exports of selected countries in 2009. Use it to answer this question. The statistical method used for representing the data above is
- A.pie chart.
- B.divided bar graph.
- C.histogram.
- D.line graph.
Show the answer and explanation
Answer: B (divided bar graph.)
Explanation
Each bar is split into two parts (imports and exports): a divided bar graph.