Question 36
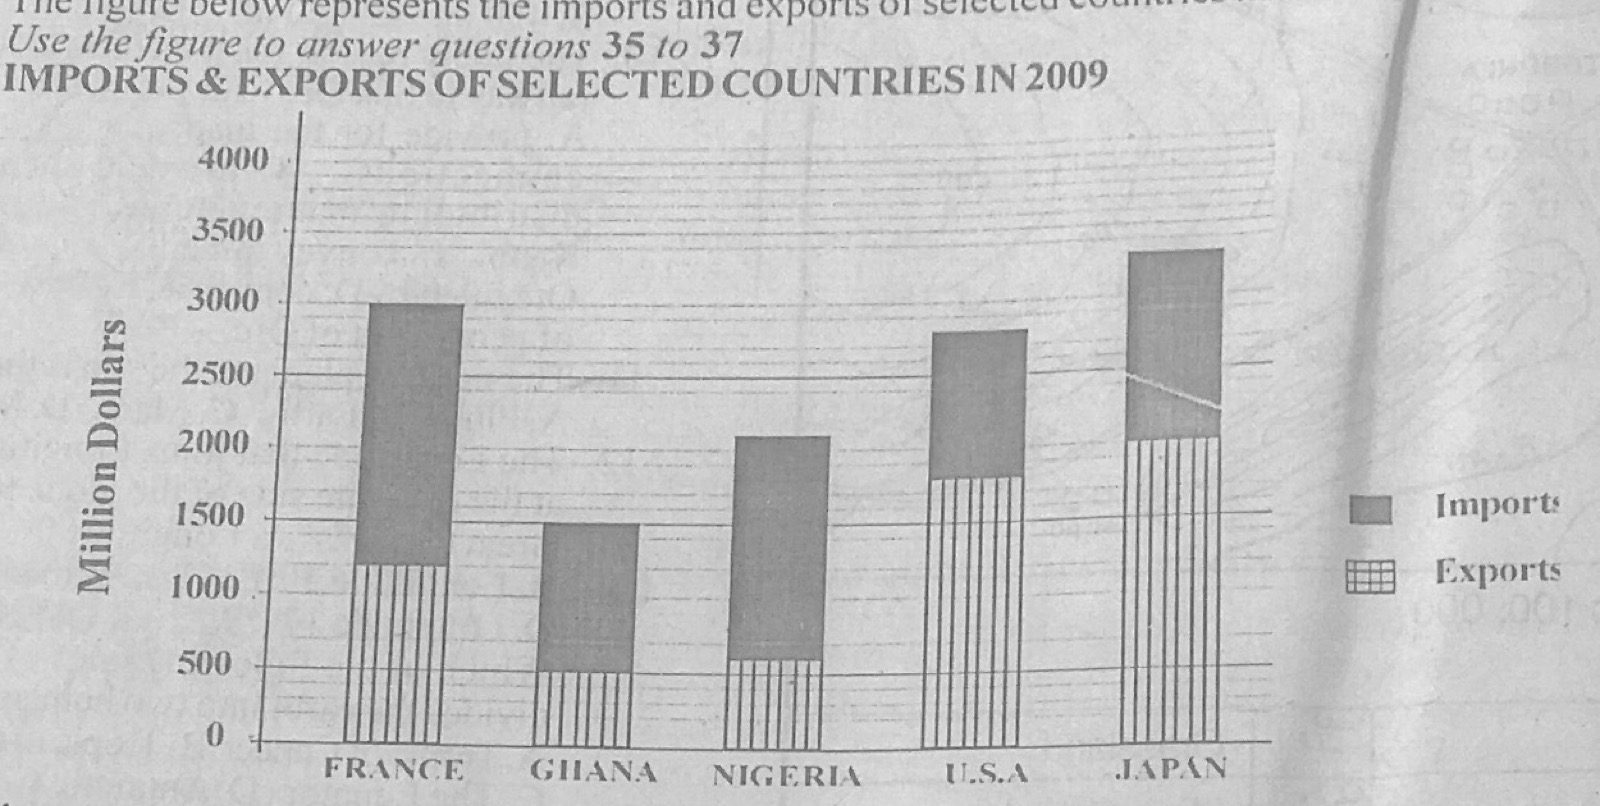
Statistical Maps and DiagramsThe figure (Imports & exports of selected countries in 2009, in million dollars) represents the imports and exports of selected countries in 2009. Use it to answer this question. How much did the United States of America (U.S.A.) spend on imports in 2009?
- A.3,000 million
- B.2,500 million
- C.1,500 million
- D.1,000 million
Show the answer and explanation
Answer: D (1,000 million)
Explanation
The U.S.A. bar reaches 2,800; exports make up about 1,800 of it, so imports are about 1,000 million.