Question 33
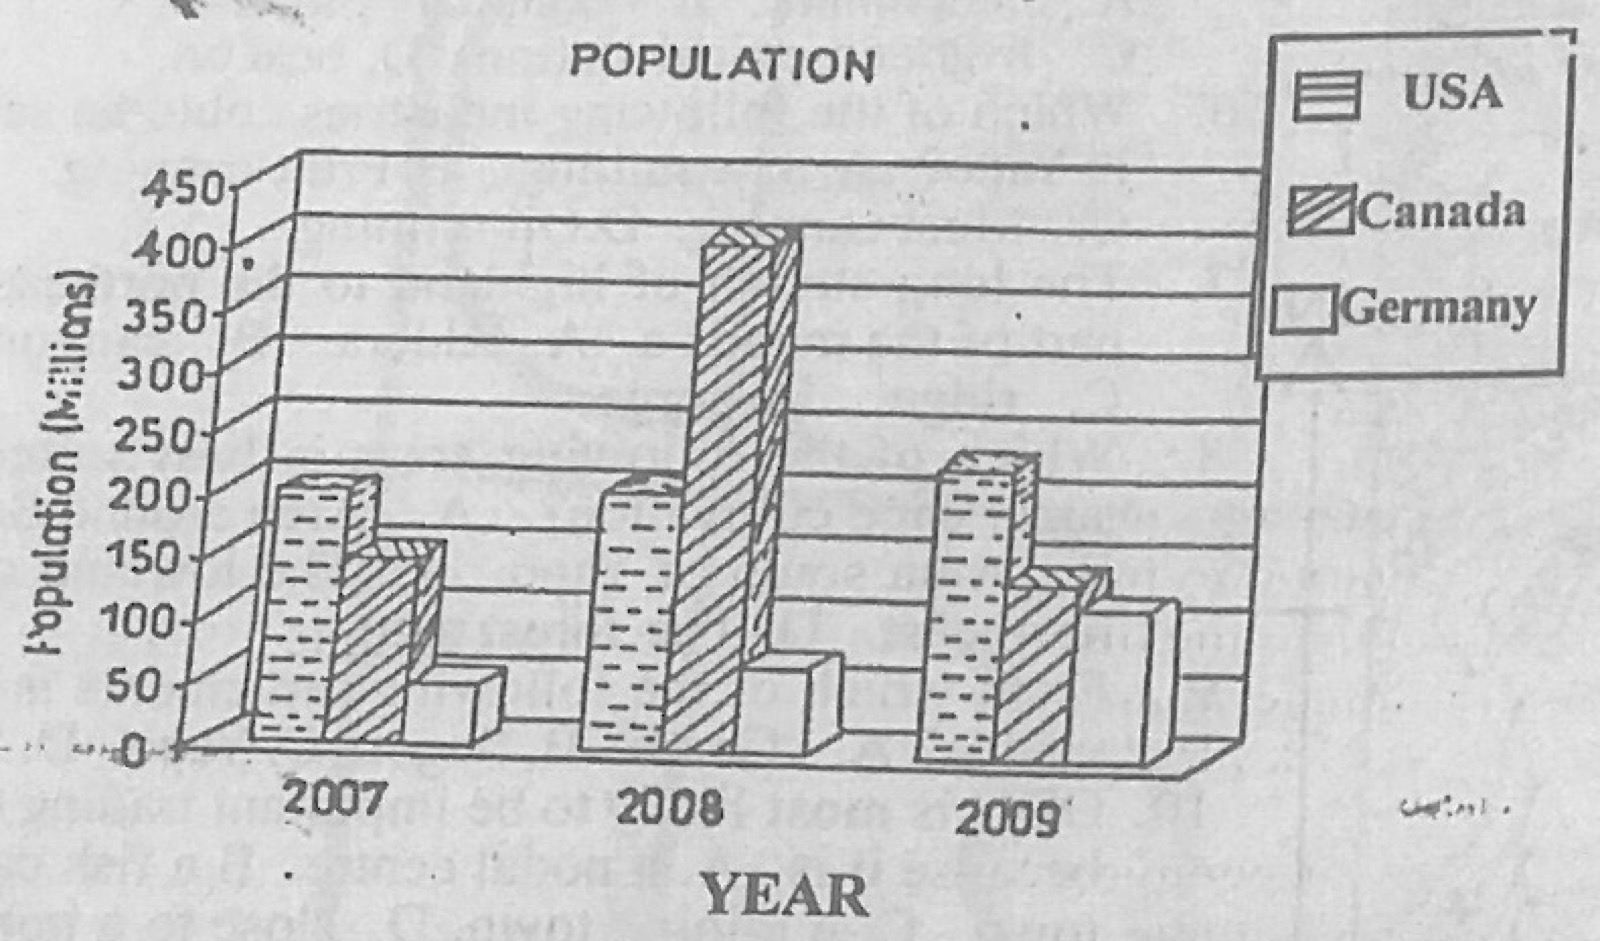
Statistical Maps and DiagramsThe diagram shows a hypothetical representation of population of selected countries (USA, Canada, Germany) in 2007, 2008 and 2009. Use it to answer this question. By how much did the population of Germany grow between 2008 and 2009?
- A.10 million.
- B.50 million.
- C.120 million.
- D.400 million.
Show the answer and explanation
Answer: B (50 million.)
Explanation
Read the Germany bars for 2008 and 2009 and subtract: the 2009 bar is about 50 million higher.