Question 32
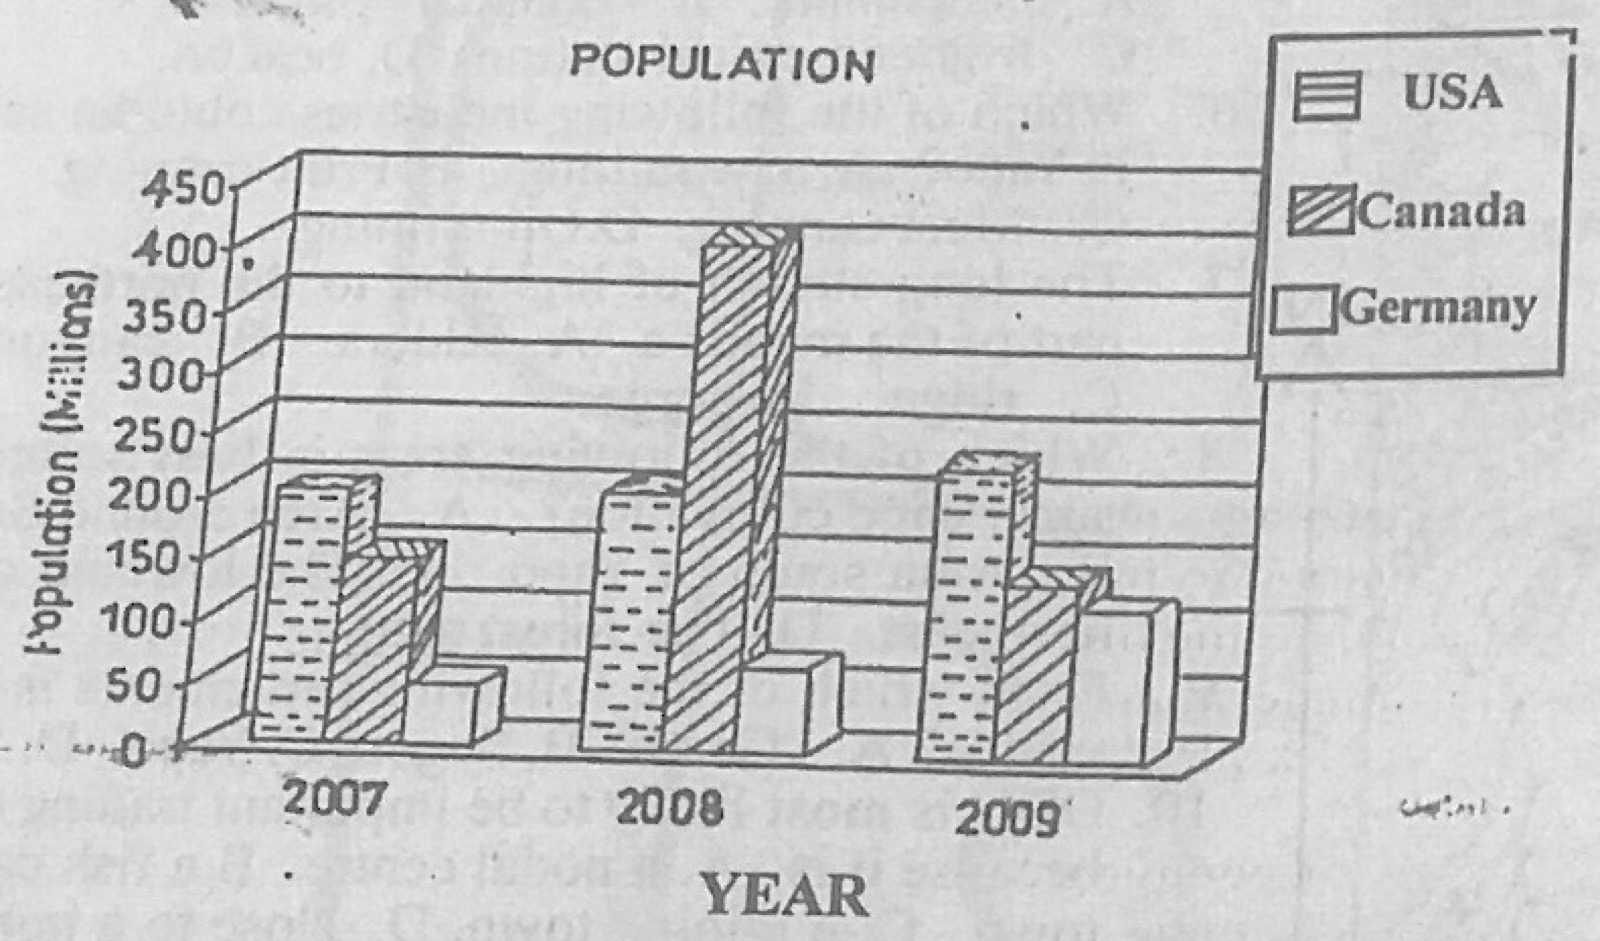
Statistical Maps and DiagramsThe diagram shows a hypothetical representation of population of selected countries (USA, Canada, Germany) in 2007, 2008 and 2009. Use it to answer this question. The population of Canada in 2008 is
- A.190 million.
- B.400 million.
- C.650 million.
- D.750 million.
Show the answer and explanation
Answer: B (400 million.)
Explanation
The Canada bar for 2008 reaches the 400 mark.