Question 12
Statistical Maps and DiagramsUse Figure 1 (Production of motor cars, 1960-1963) to answer this question. The greatest advantage of the Figure 1 is that it
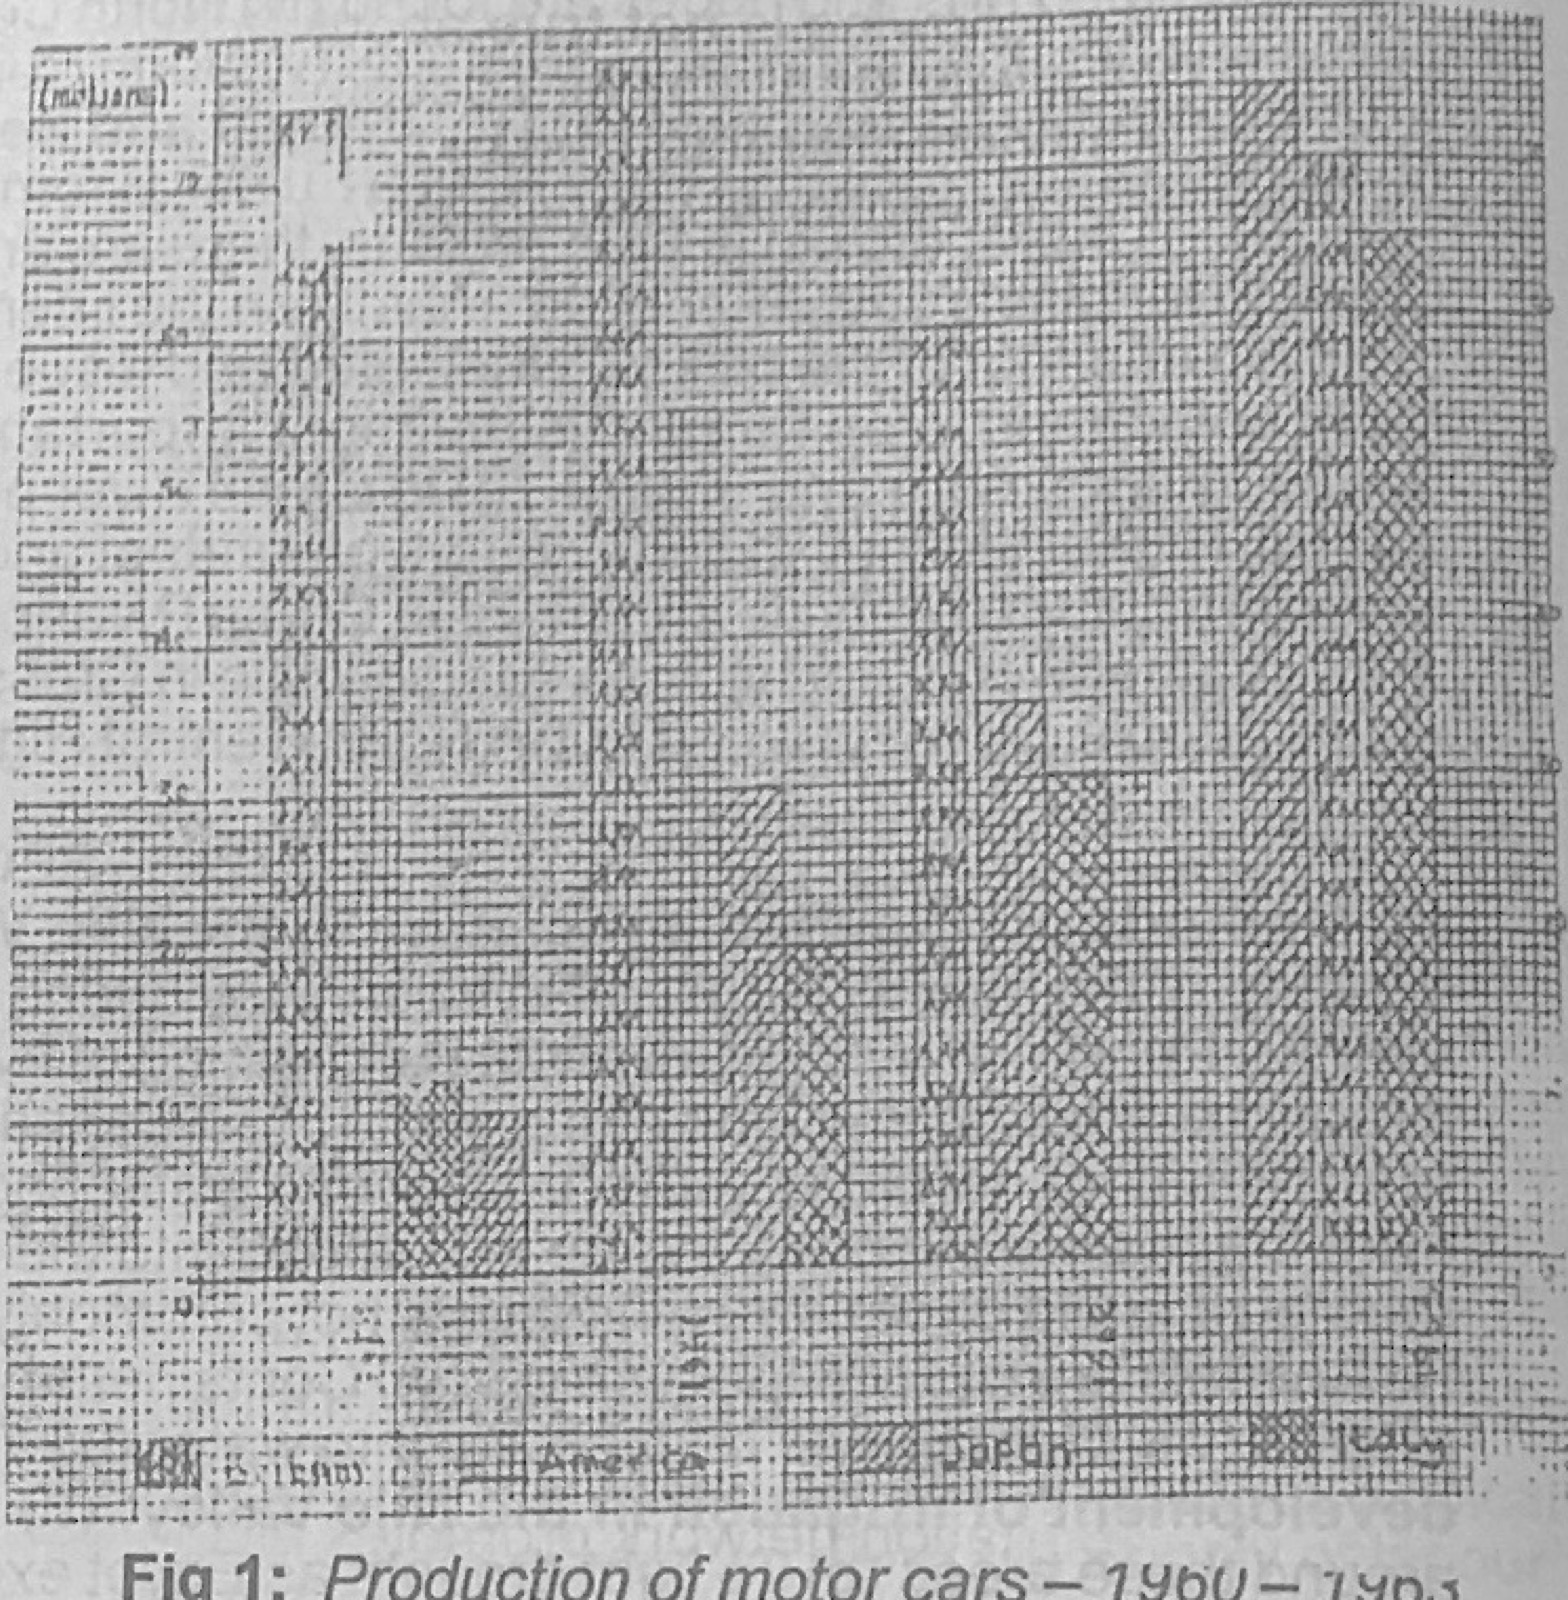
- A.makes for easy comparison of the data represented
- B.shows the total value of the data represented.
- C.shows the percentage decrease in the value of the data represented.
- D.is very easy to construct.
Show the answer and explanation
Answer: A (makes for easy comparison of the data represented)
Explanation
Bars for each country stand side by side, so their production can be compared at a glance.