Question 11
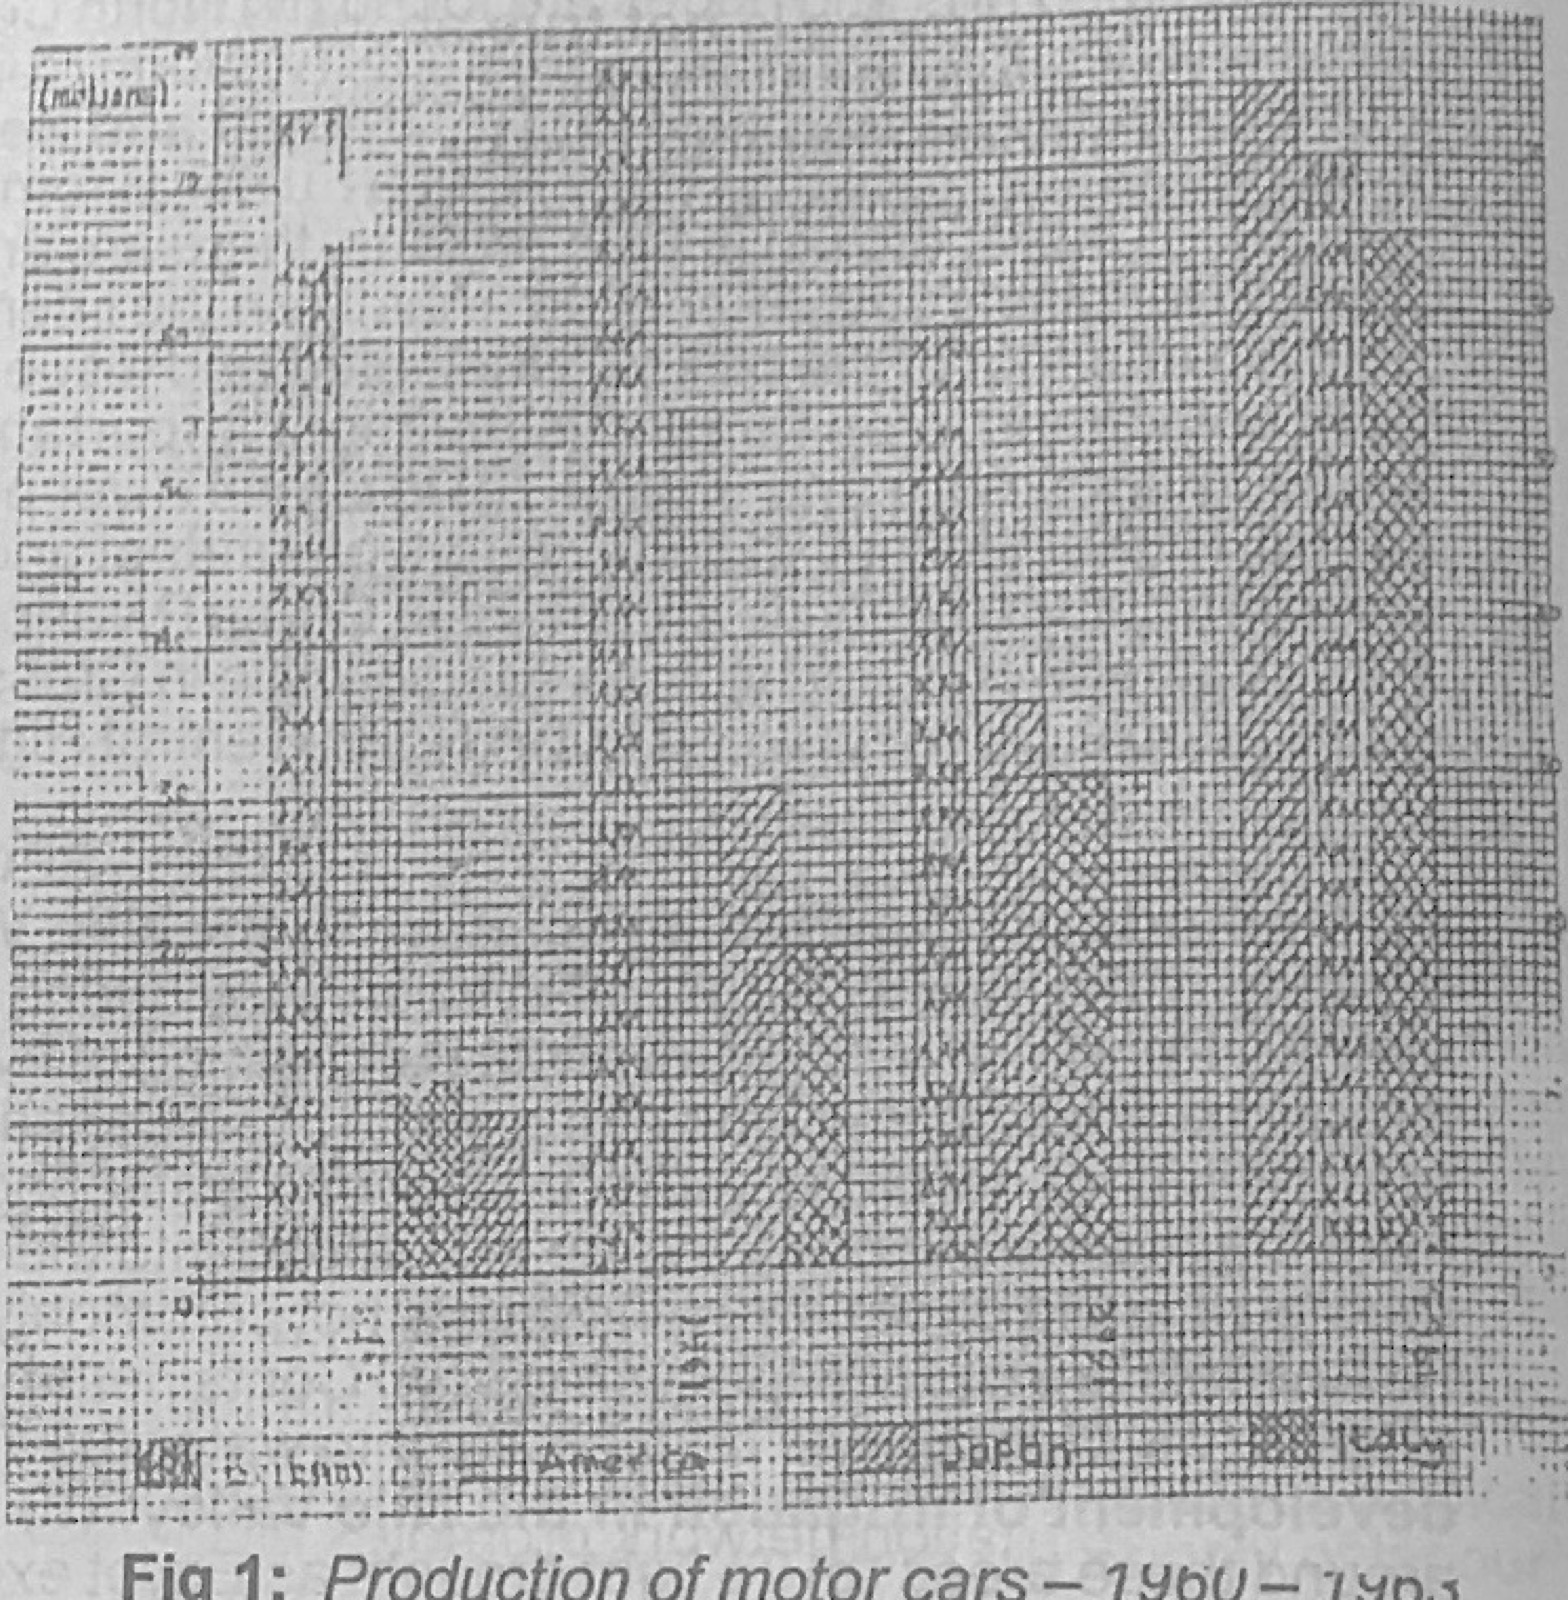
Statistical Maps and DiagramsUse Figure 1 (Production of motor cars, 1960-1963) to answer this question. The Figure 1 is known as
- A.simple bar graph
- B.divided bar graph
- C.percentage bar graph
- D.group bar graph
Show the answer and explanation
Answer: D (group bar graph)
Explanation
Figure 1 shows separate bars for Britain, America, Japan and Italy placed side by side for each year, which is a group (multiple) bar graph.