Question 40
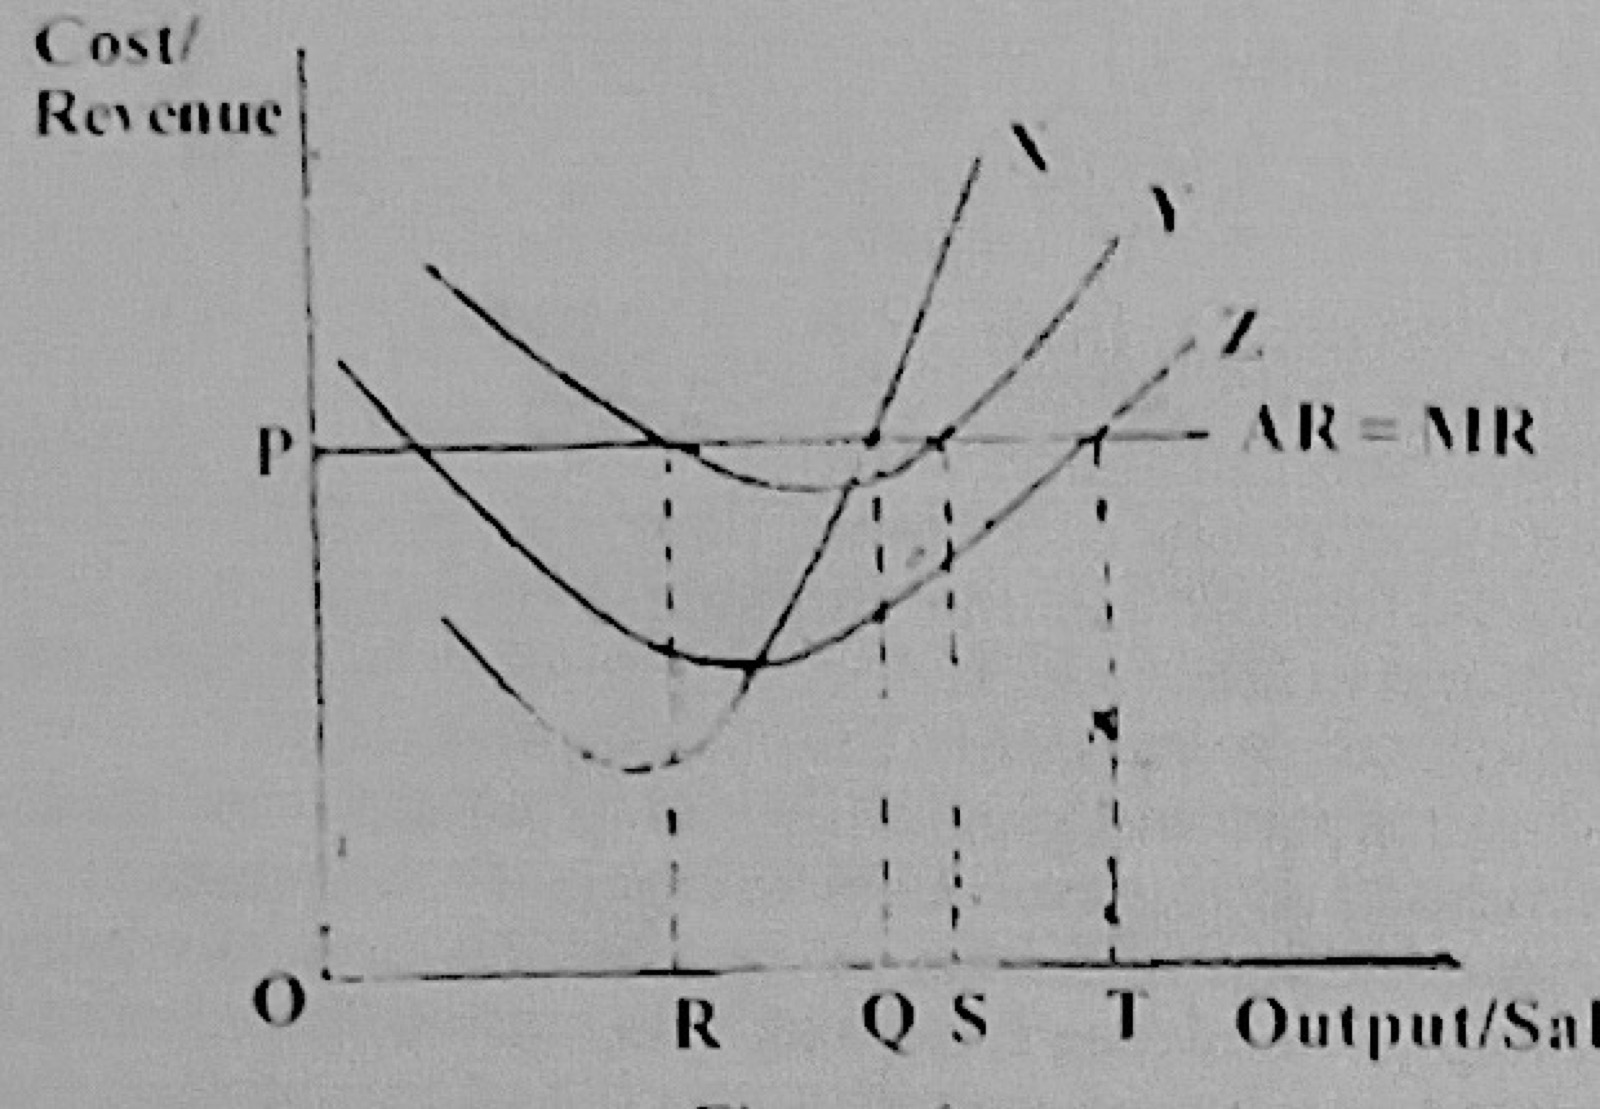
Theory of Costs and RevenueUse Figure 2 (a firm's cost curves X, Y and Z with AR = MR at price P) to answer the question. The interval between curves Y and Z represents
- A.average fixed cost.
- B.total fixed cost.
- C.total cost.
- D.average total cost.
Show the answer and explanation
Answer: A (average fixed cost.)
Explanation
ATC − AVC = AFC, so the gap between Y (ATC) and Z (AVC) is average fixed cost.