Question 39
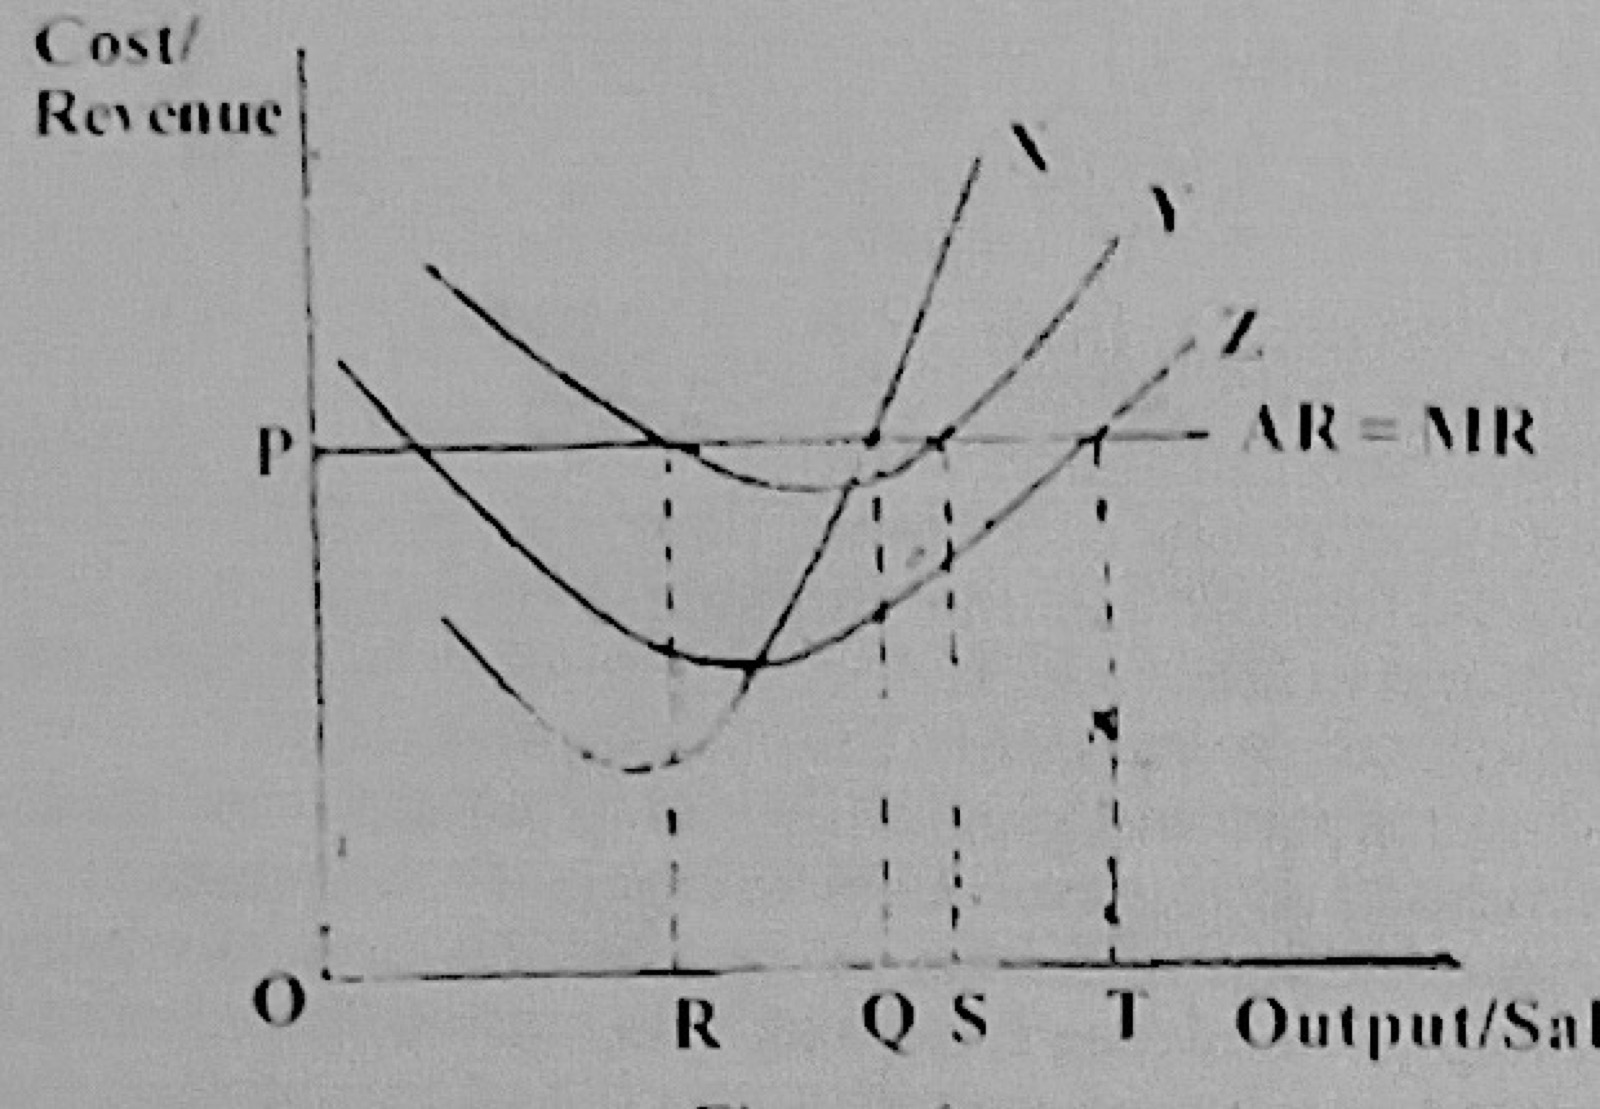
Market StructuresUse Figure 2 (a firm's cost curves X, Y and Z with AR = MR at price P) to answer the question. The equilibrium output level is at output
- A.R.
- B.Q.
- C.T.
- D.S.
Show the answer and explanation
Answer: B (Q.)
Explanation
Profit is maximised where the rising MC curve X cuts AR = MR, at output Q.