Question 48
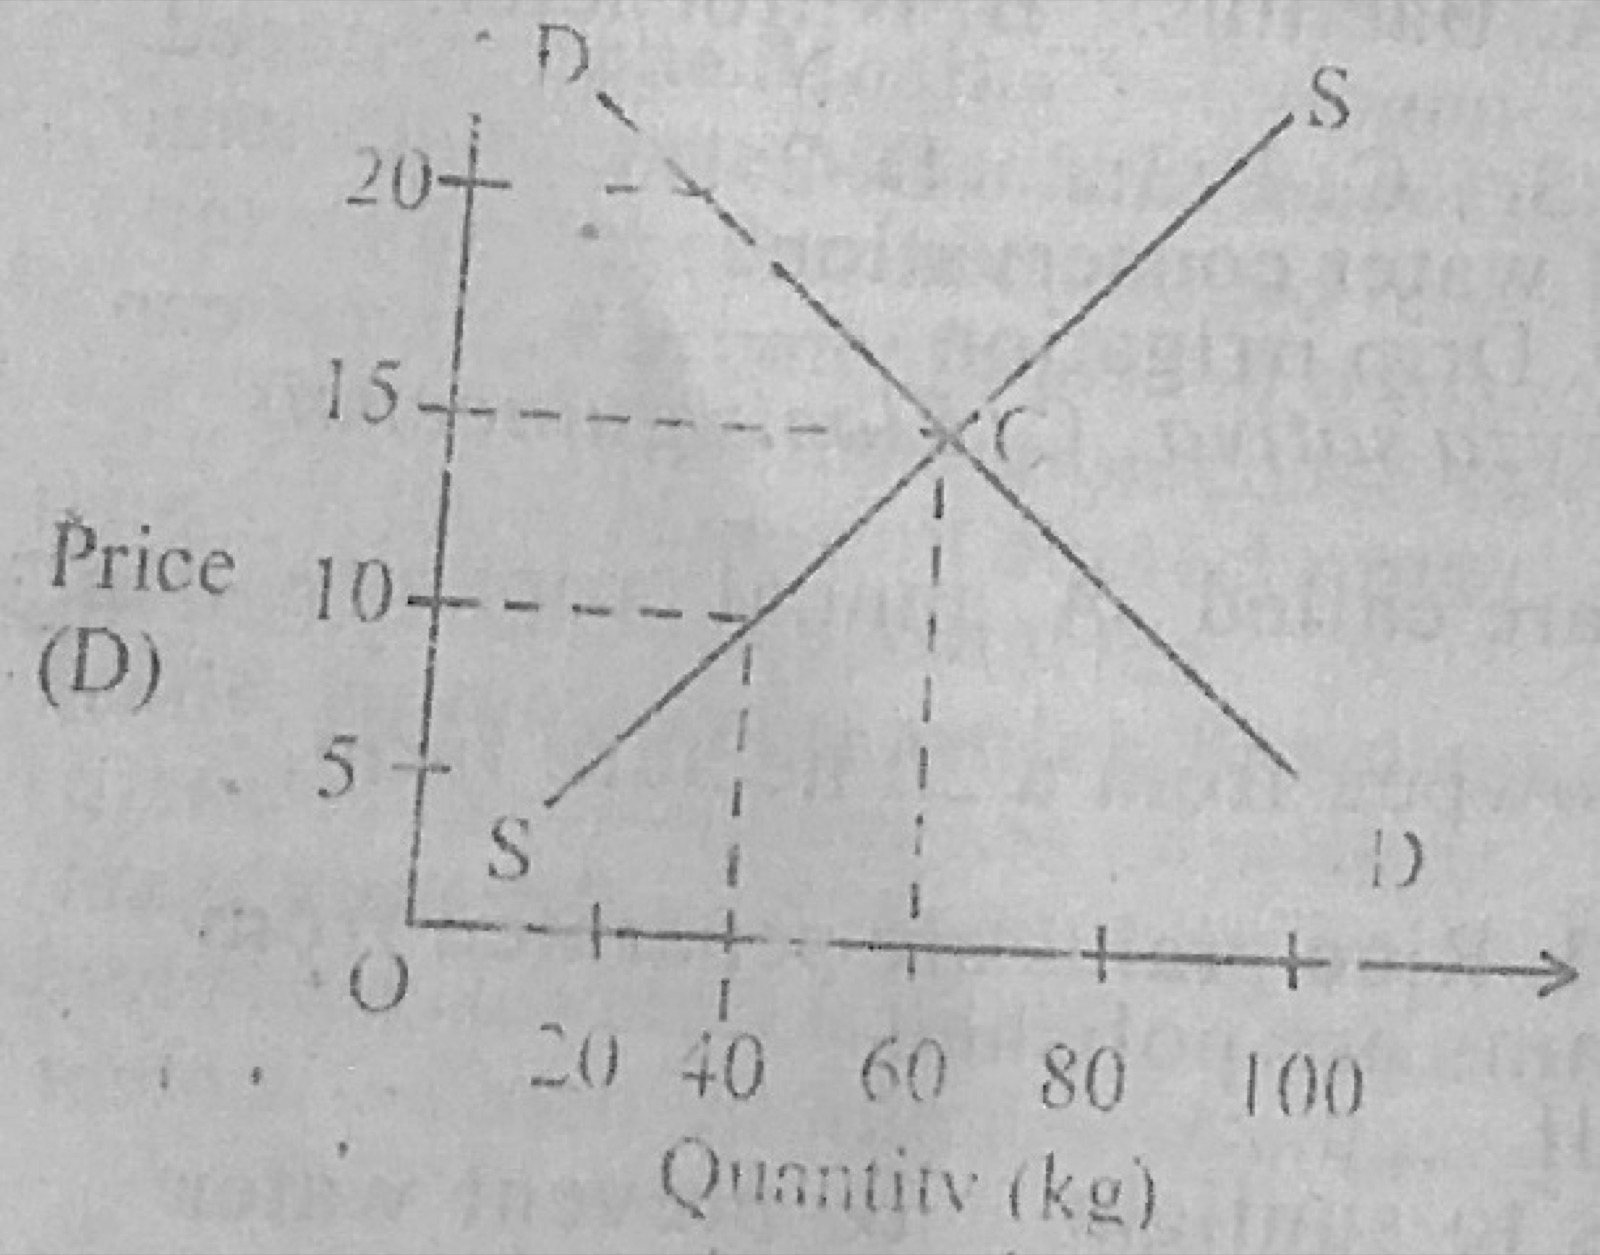
Basic Agricultural EconomicsThe diagram below is a demand and supply graph.
A farmer whose production exceeds point C will experience
- A.surplus to the market.
- B.shortfalls in supply.
- C.decrease in cost of production.
- D.decrease in revenue generated.
Show the answer and explanation
Answer: A (surplus to the market.)
Explanation
Supplying more than the equilibrium quantity leaves unsold surplus.