Question 47
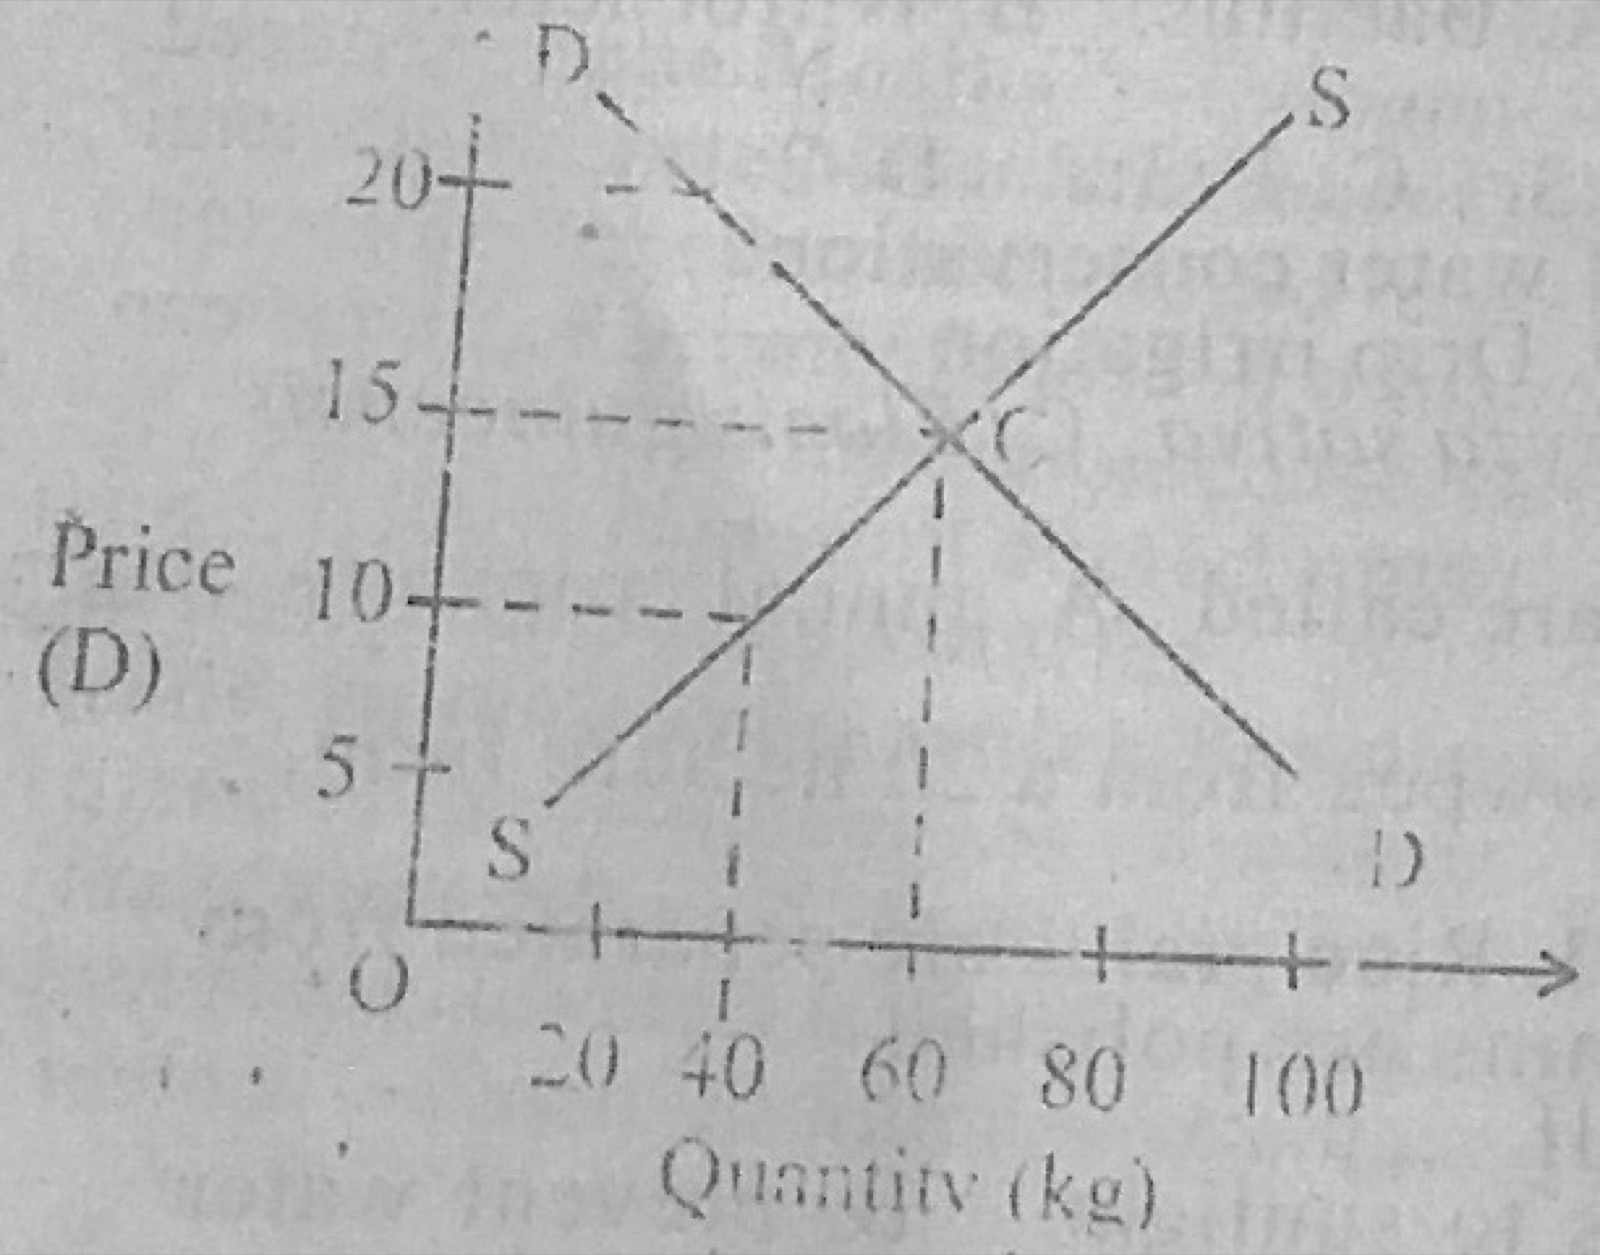
Basic Agricultural EconomicsThe diagram below is a demand and supply graph.
The part labelled C in the graph is the
- A.quantity supplied.
- B.equilibrium price.
- C.quantity demanded.
- D.equilibrium point.
Show the answer and explanation
Answer: D (equilibrium point.)
Explanation
C is where the demand and supply curves cross: the equilibrium point.