Question 19
Change of State and VapoursWhich of the following graphs clearly illustrates the temperature change which takes place as a piece of ice at − 10°C is heated slowly?
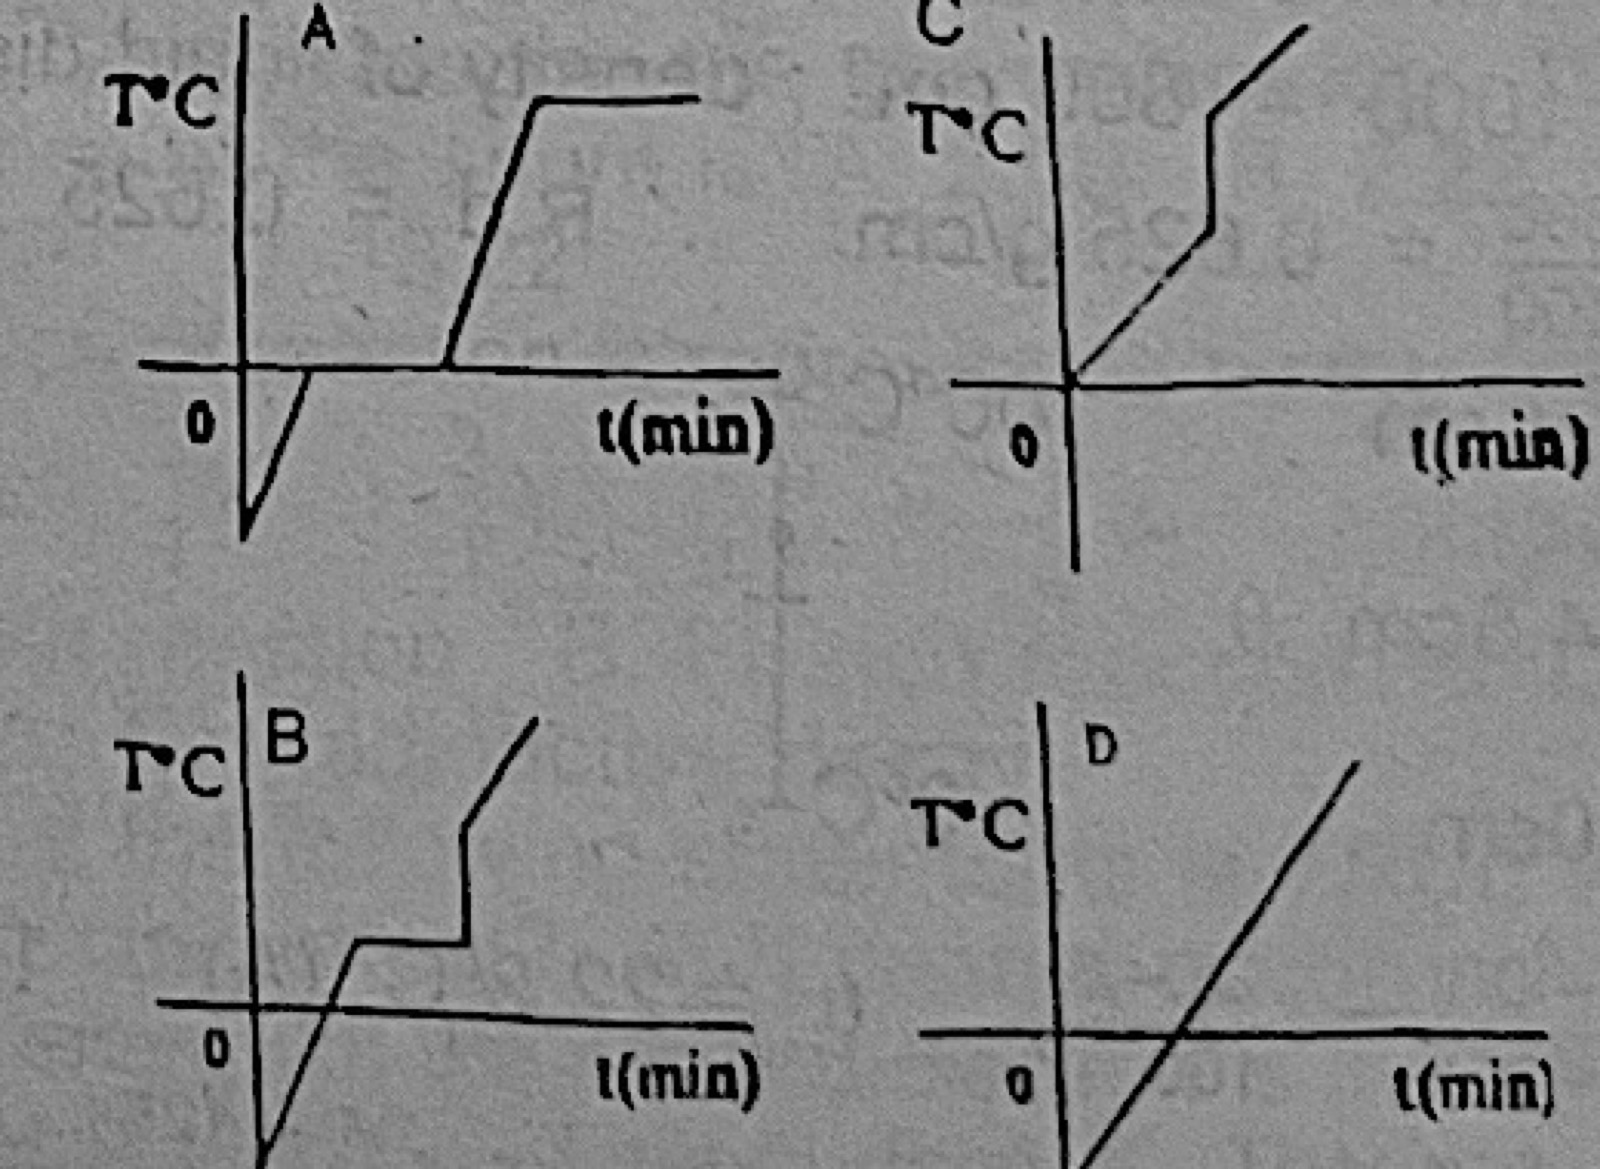
- A.A
- B.B
- C.C
- D.D
Show the answer and explanation
Answer: A (A)
Explanation
The temperature rises from −10°C to 0°C, stays at 0°C while the ice melts, rises to 100°C and stays there while the water boils, as in A.