Question 20
Gas LawsA fixed quantity of gas is subjected to various pressures P and the corresponding volumes V measured at a constant temperature. Which of the following graphs best represent the results?
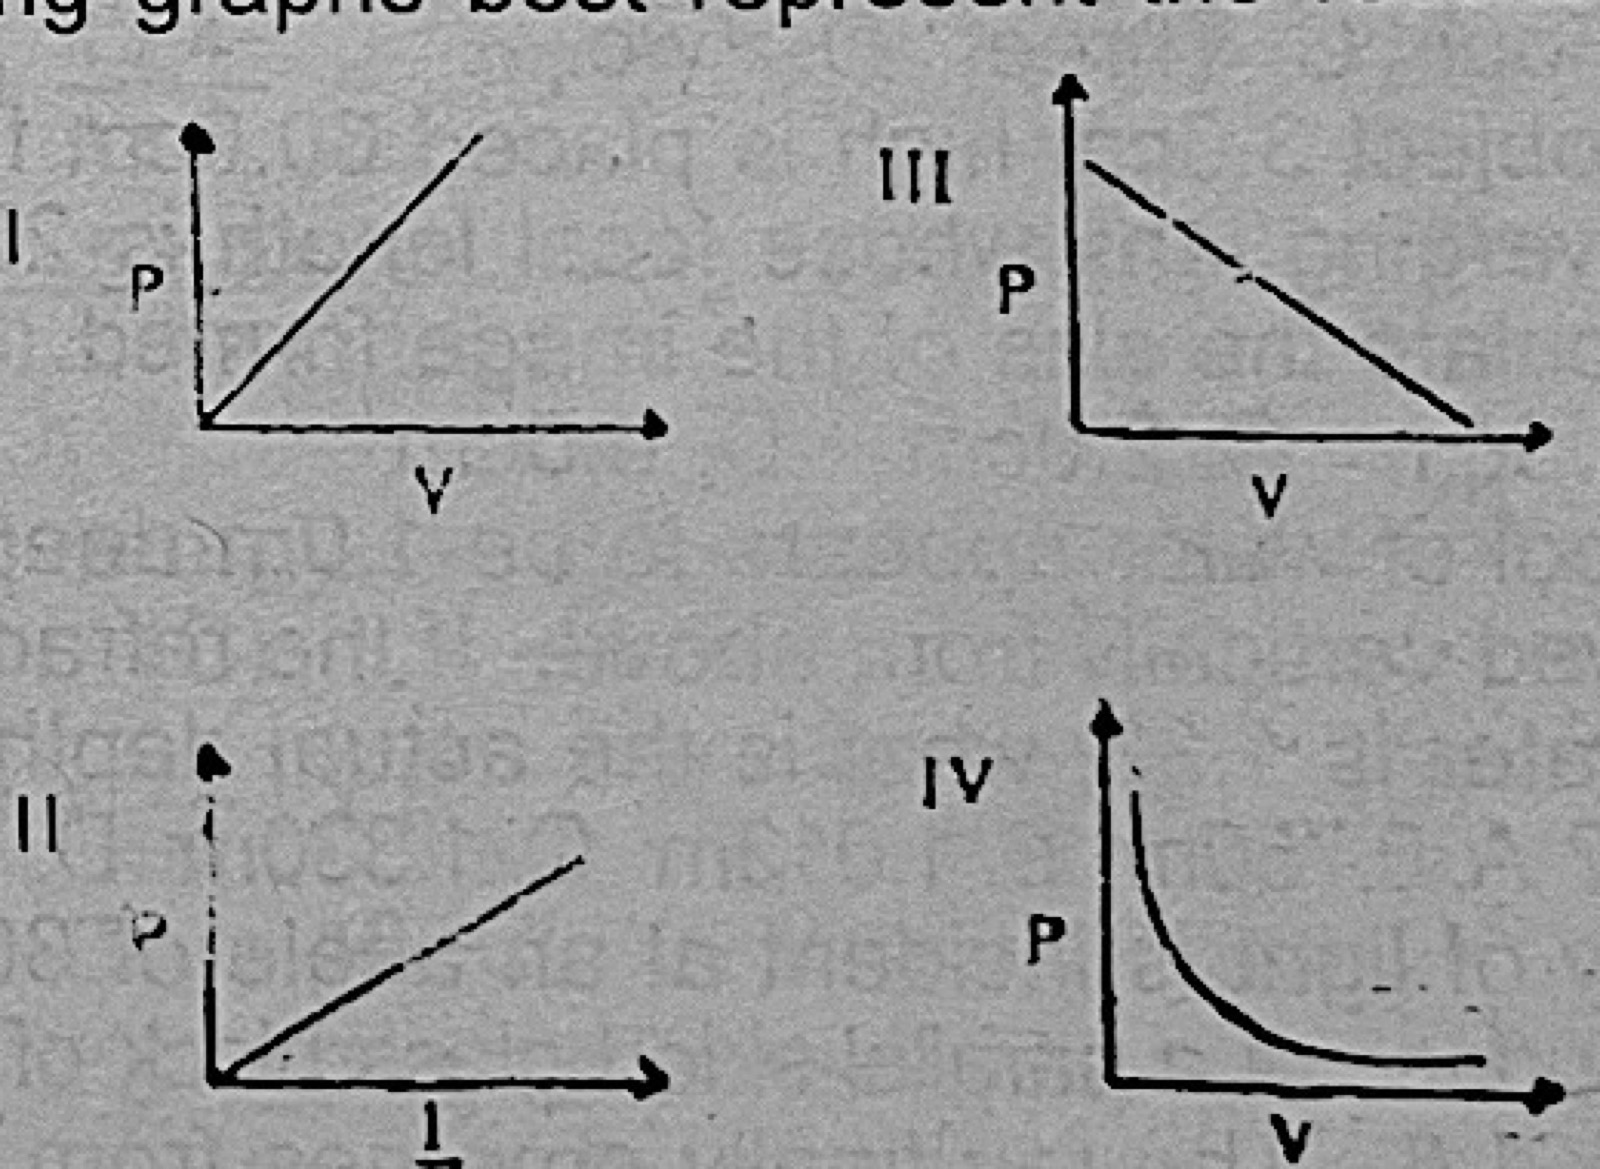
- A.I, II
- B.II, III
- C.II, IV
- D.III, IV.
Show the answer and explanation
Answer: C (II, IV)
Explanation
Boyle's law, pV = constant: p against 1/V is a straight line through the origin (II) and p against V is a curve that falls steeply then levels off (IV).