Question 5
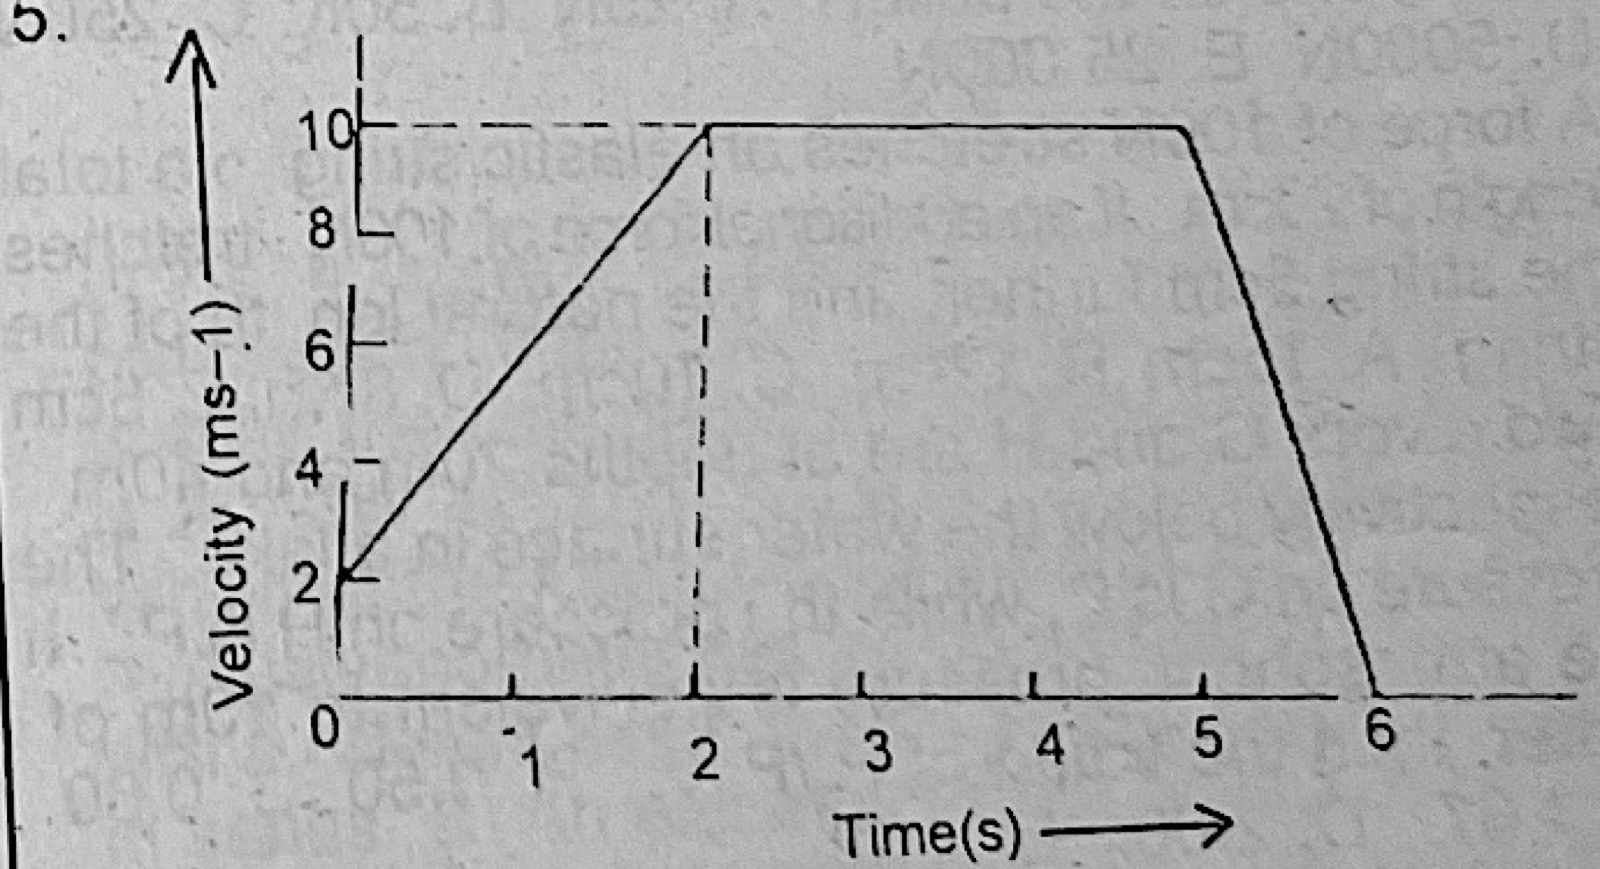
MotionThe graph in Fig. 1 above describes the motion of a particle. The acceleration of the particle during the motion is
- A.0.00 m s−2
- B.0.25 m s−2
- C.4.00 m s−2
- D.8.00 m s−2
- E.10.00 m s−2.
Show the answer and explanation
Answer: C (4.00 m s−2)
Explanation
Acceleration is the slope of the rising part of the graph: the velocity goes from 2 to 10 m s−1 in 2 s, so a = 8/2 = 4 m s−2.