Question 45
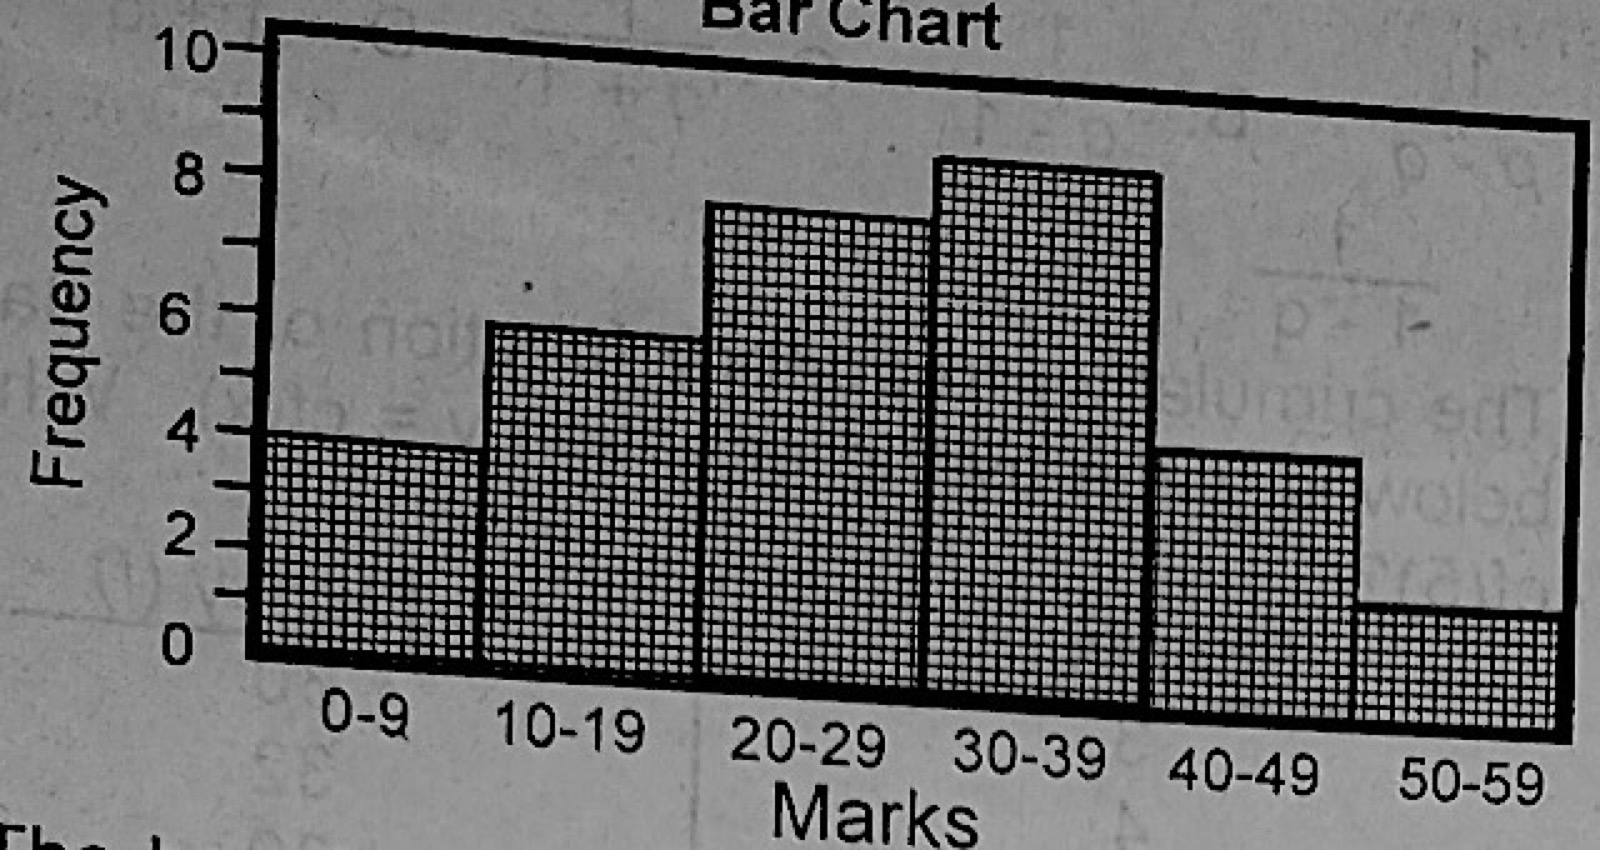
Data PresentationThe bar chart above shows the mark distribution in a class test. Find the number of students in the class.
- A.9
- B.2
- C.60
- D.30
- E.34
Show the answer and explanation
Answer: E (34)
Explanation
The number of students is the sum of the bar heights (frequencies) for all the mark groups.