Question 45
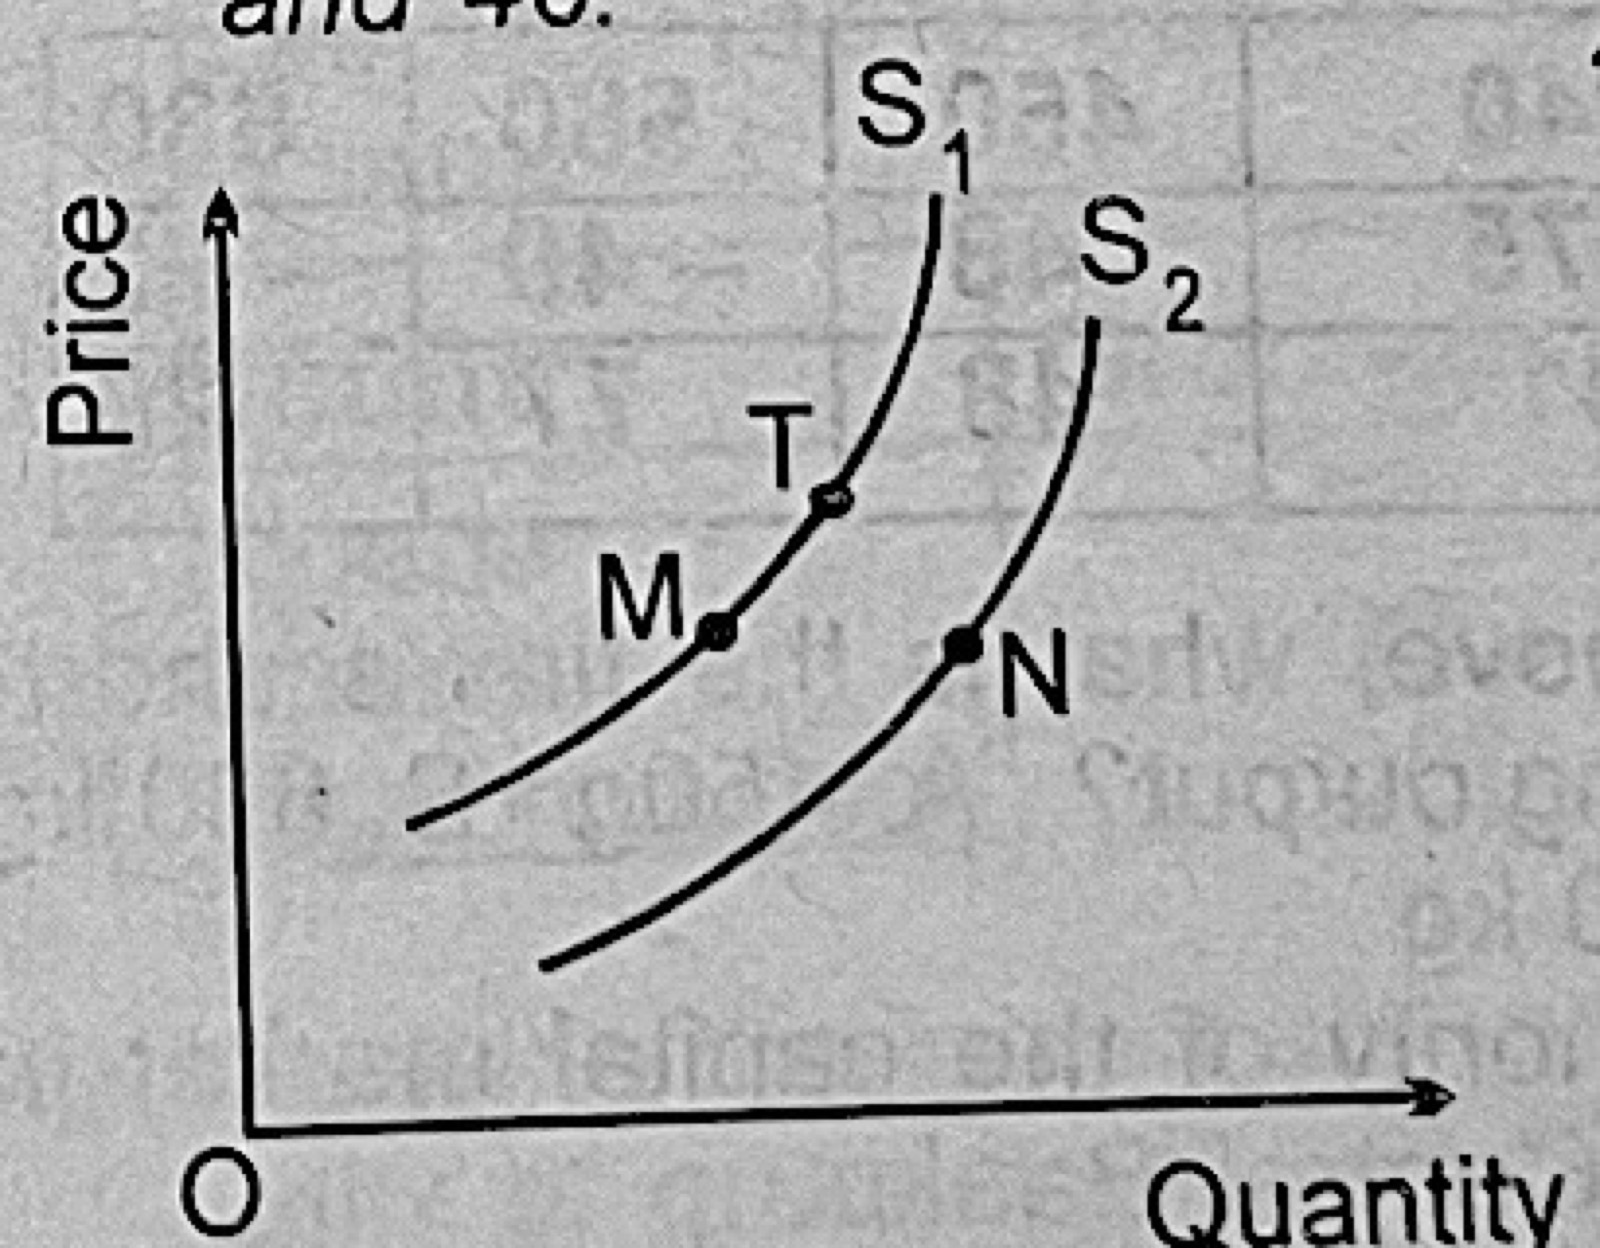
Price DeterminationUse the diagram above to answer this question. When there is a change from T to N, it implies that
- A.supply has increased
- B.quantity supplied has increased
- C.quantity demanded has increased
- D.price has fallen
Show the answer and explanation
Answer: A (supply has increased)
Explanation
Use the diagram. T is on S1 and N is on S2, which lies to the right; moving to a new curve to the right means supply has increased.