Question 44
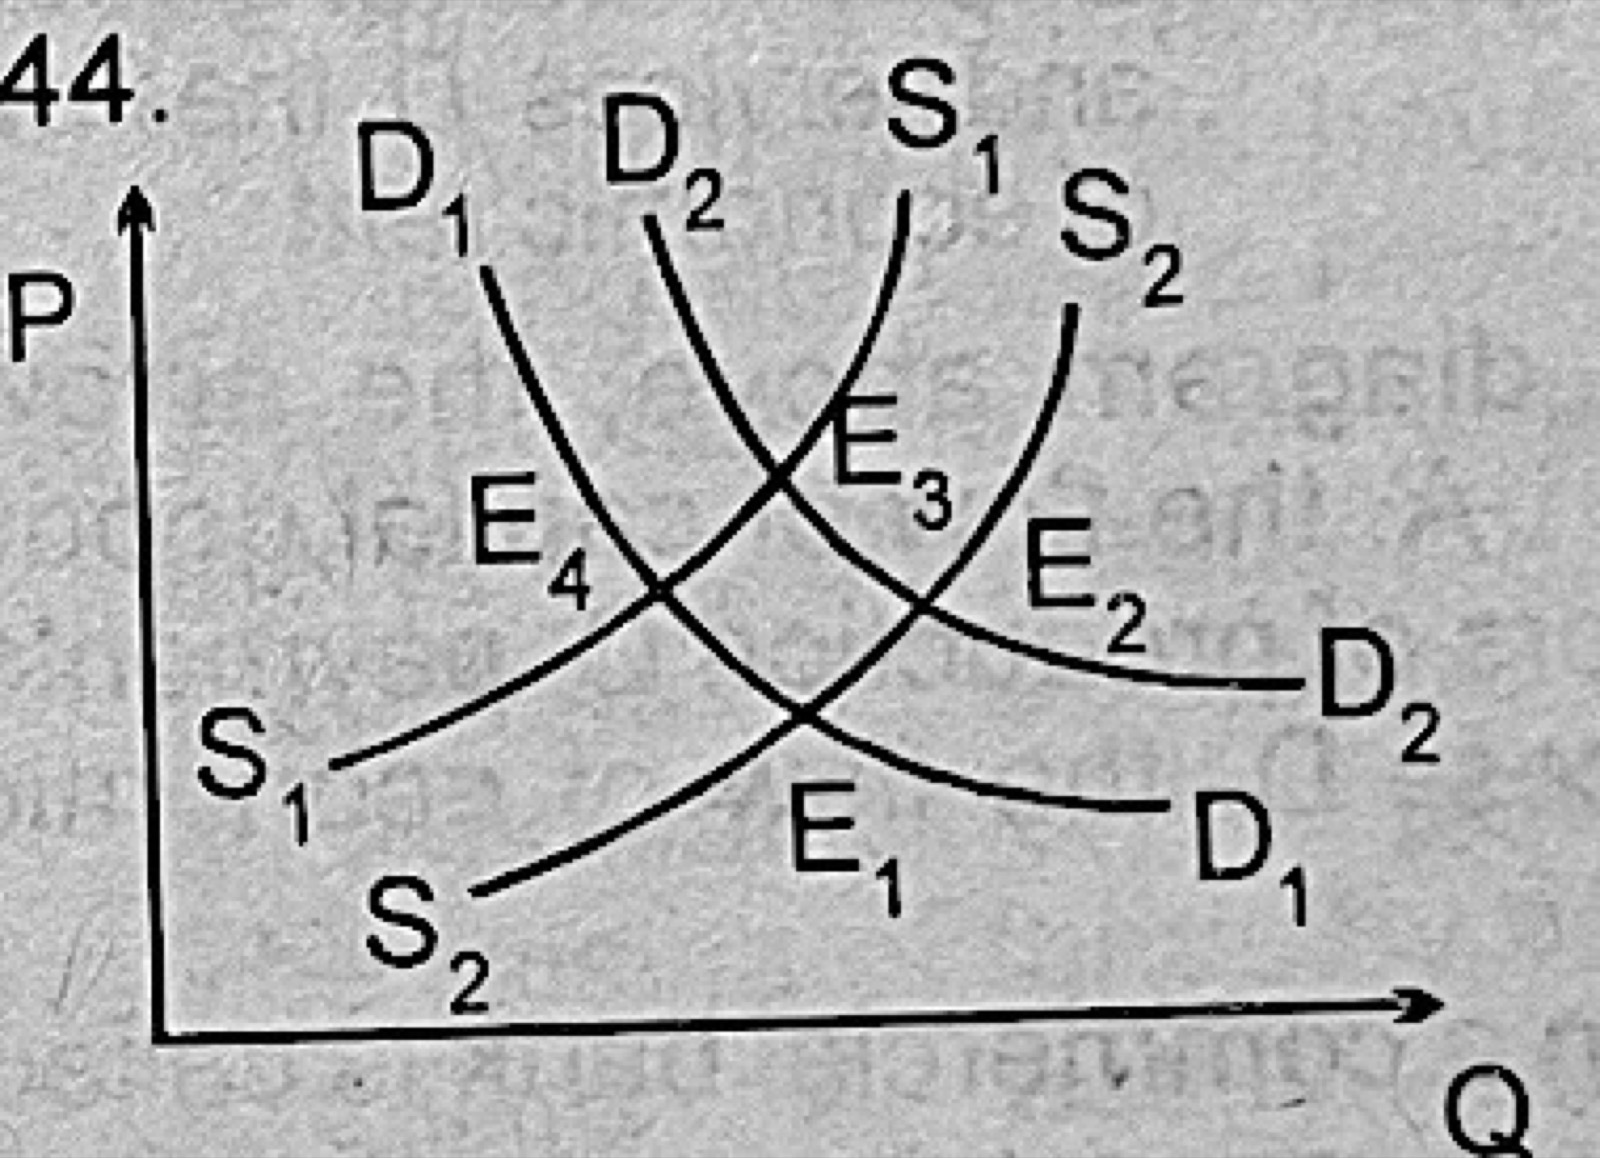
Price DeterminationThe diagram above shows the shifts in both demand and supply curves. What is the new equilibrium point after the shifts?
- A.E3
- B.E1
- C.E4
- D.E2
Show the answer and explanation
Answer: D (E2)
Explanation
Use the diagram. Demand shifts from D1 to D2 and supply from S1 to S2; the new equilibrium is where D2 crosses S2, at E2.