Question 35
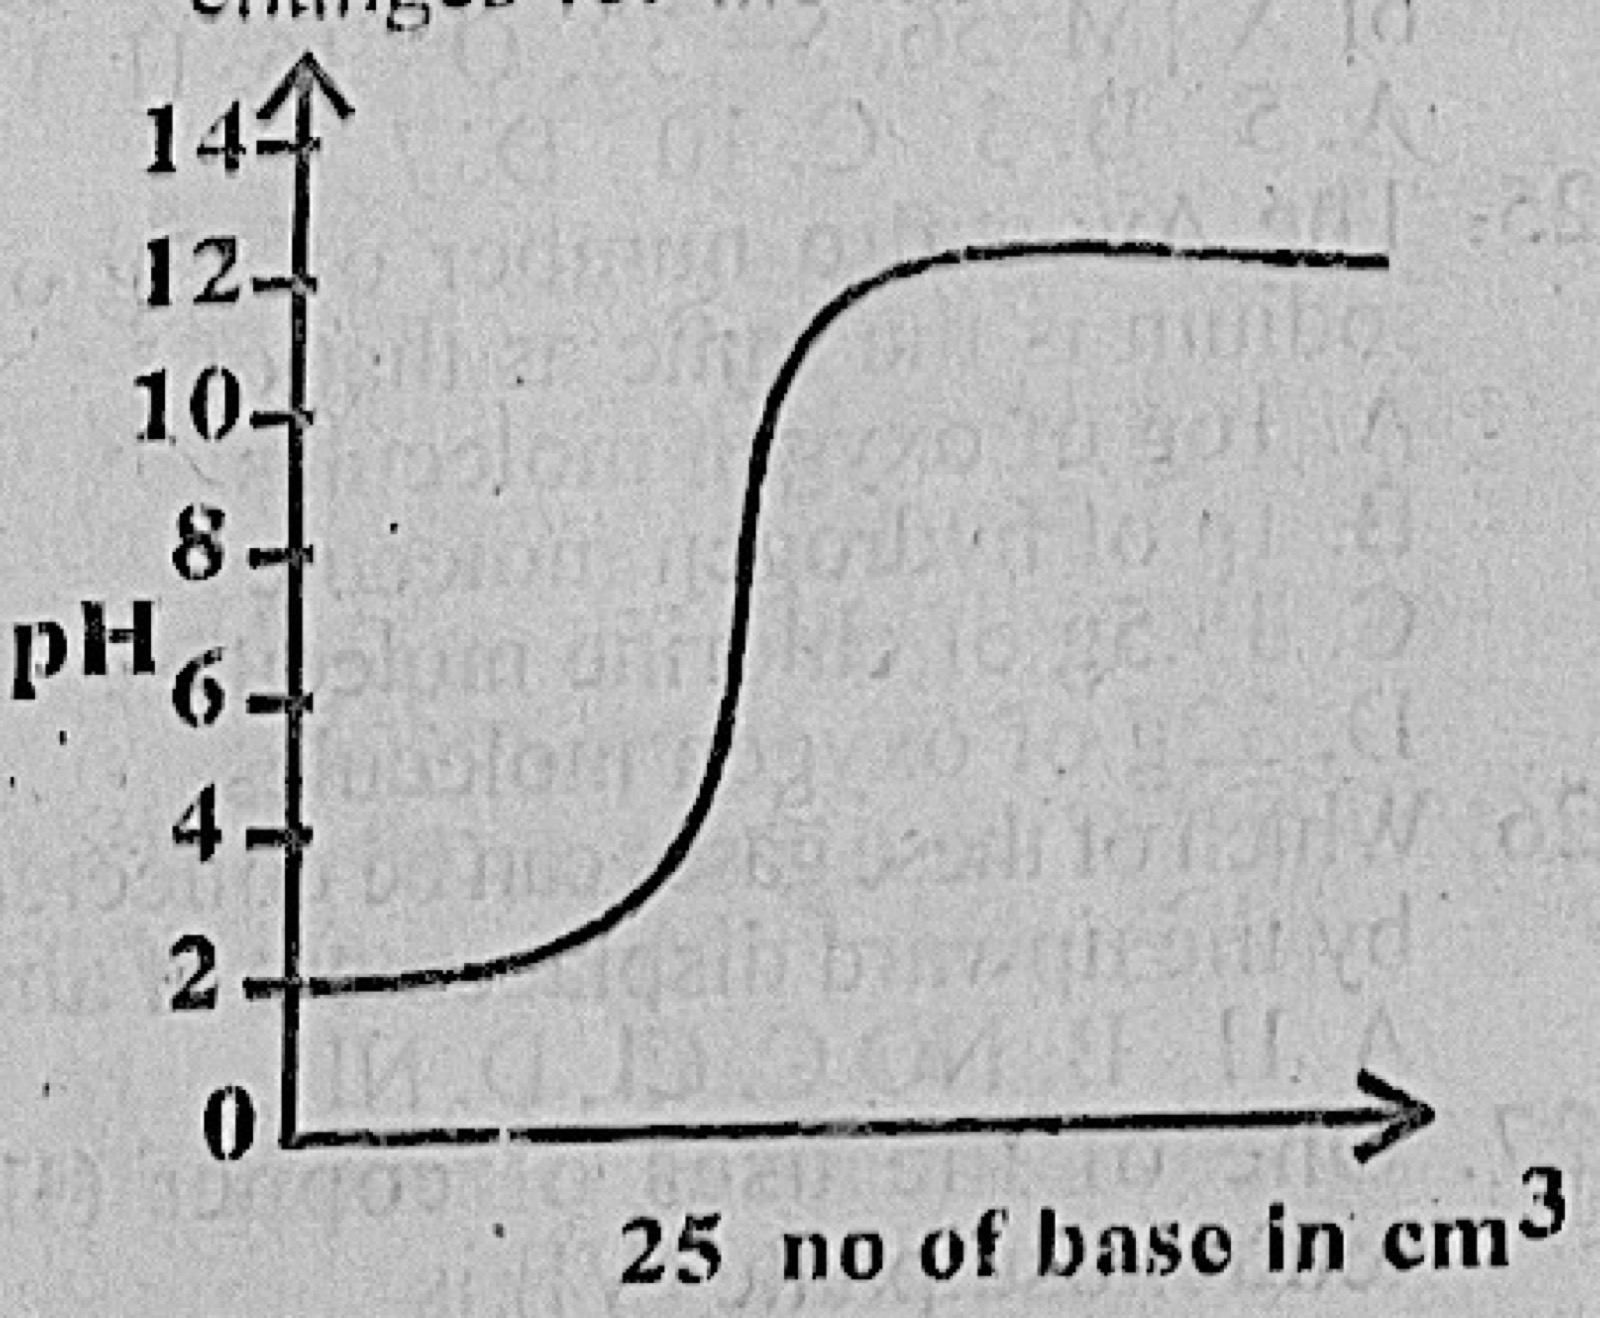
Volumetric AnalysisThe graph below illustrates the pH changes for the titration of a
- A.weak acid versus strong base
- B.strong acid versus strong base
- C.weak acid versus weak base
- D.strong acid versus weak base
Show the answer and explanation
Answer: B (strong acid versus strong base)
Explanation
The pH starts low (about 2), ends high (about 12) and jumps steeply around 7 at the end point, which is typical of a strong acid against a strong base.