Question 44
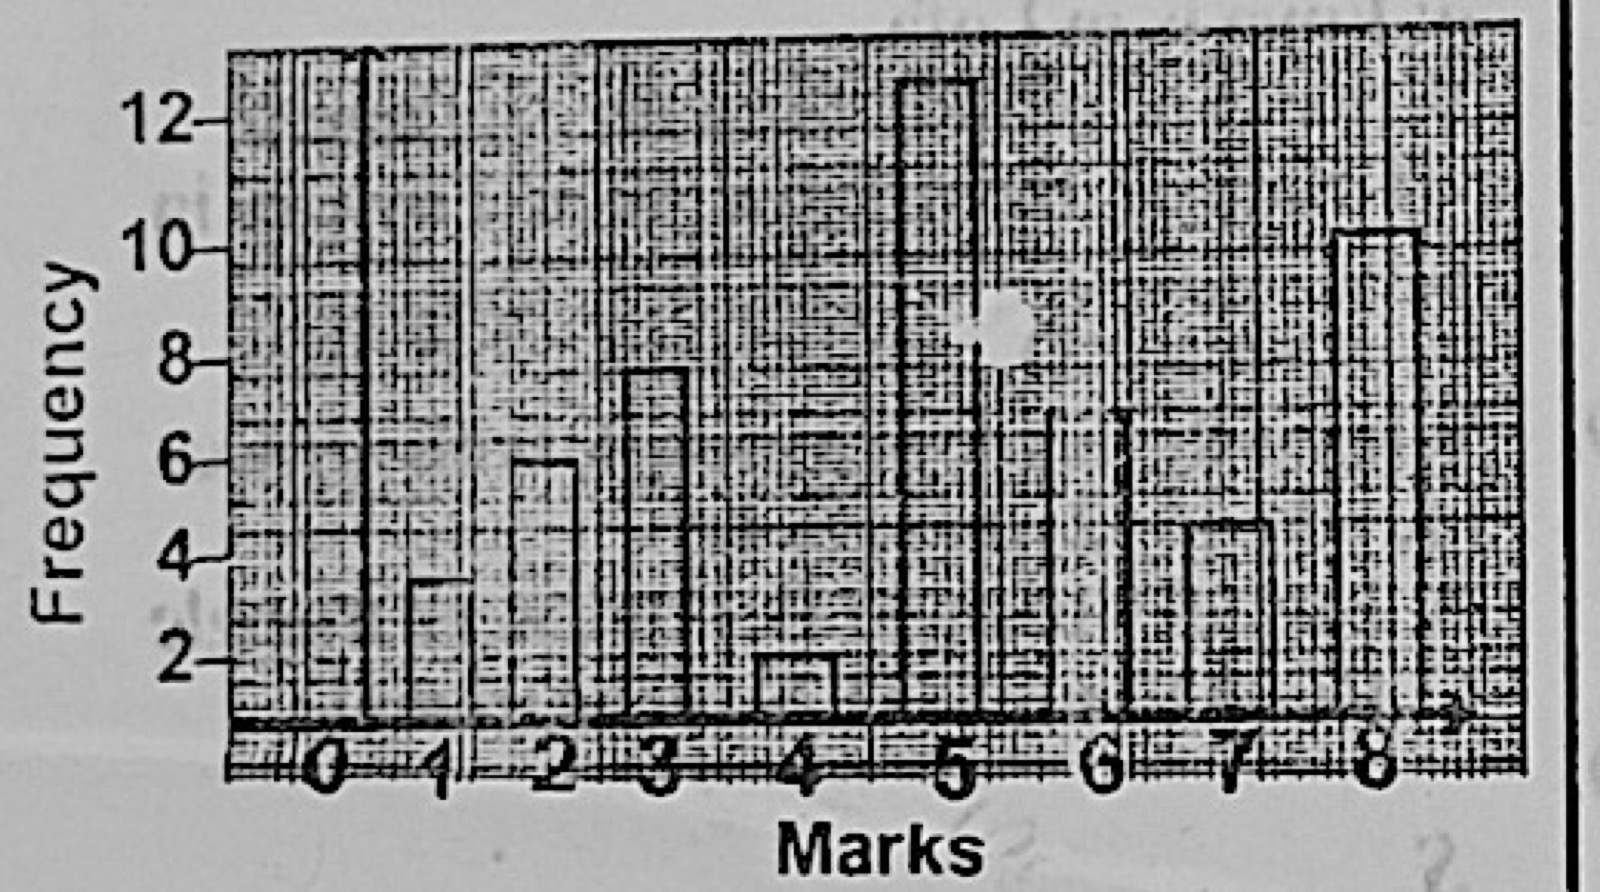
Data PresentationThe bar chart represents the distribution of marks scored by students in an Economics examination. How many students scored at least 3 marks?
- A.18
- B.52
- C.44
- D.38
Show the answer and explanation
Answer: C (44)
Explanation
Only those scoring 1 or 2 marks are excluded: 53 − (3 + 6) = 44.