Question 28
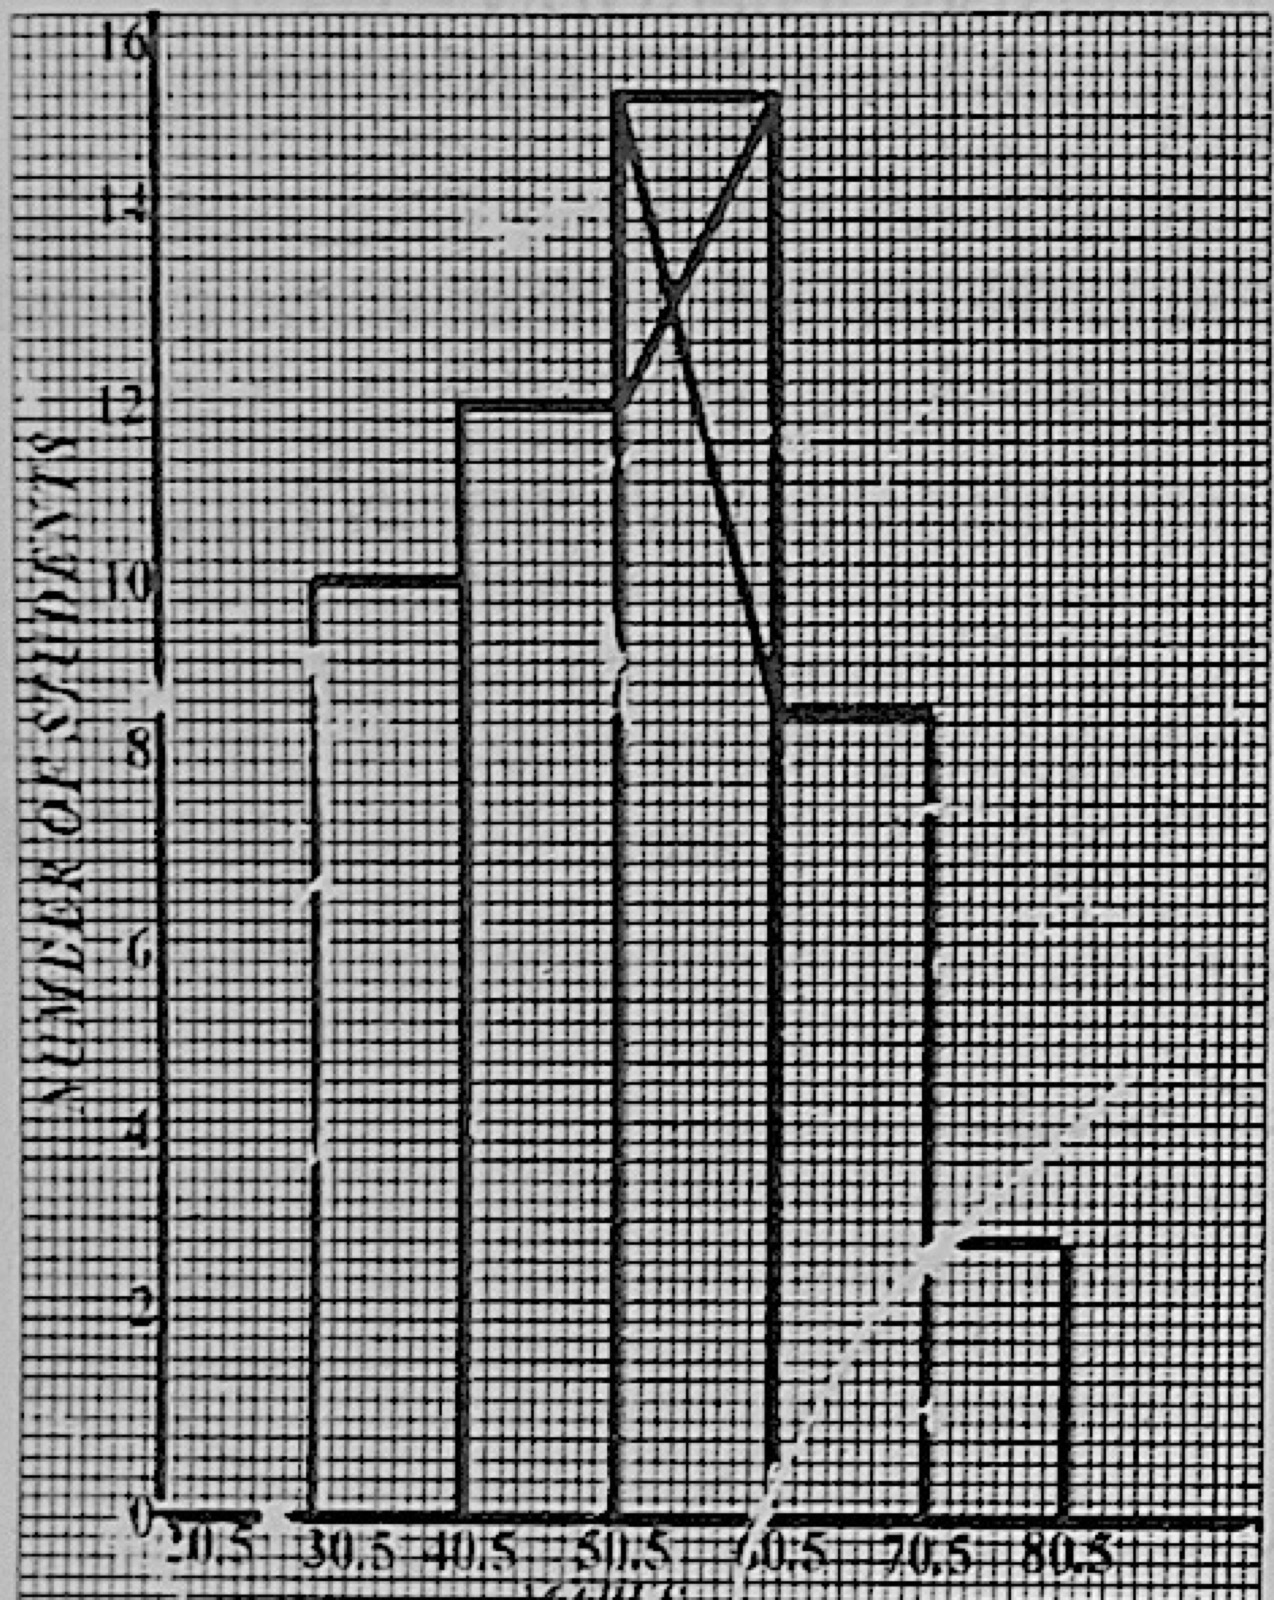
Data PresentationUse the histogram to answer this question. Estimate the mode of the distribution.
- A.51.5
- B.52.5
- C.53.3
- D.54.5
Show the answer and explanation
Answer: C (53.3)
Explanation
The tallest bar is 50.5–60.5. The lines joining its top corners to the neighbouring bars cross at about 53.3.