Question 31
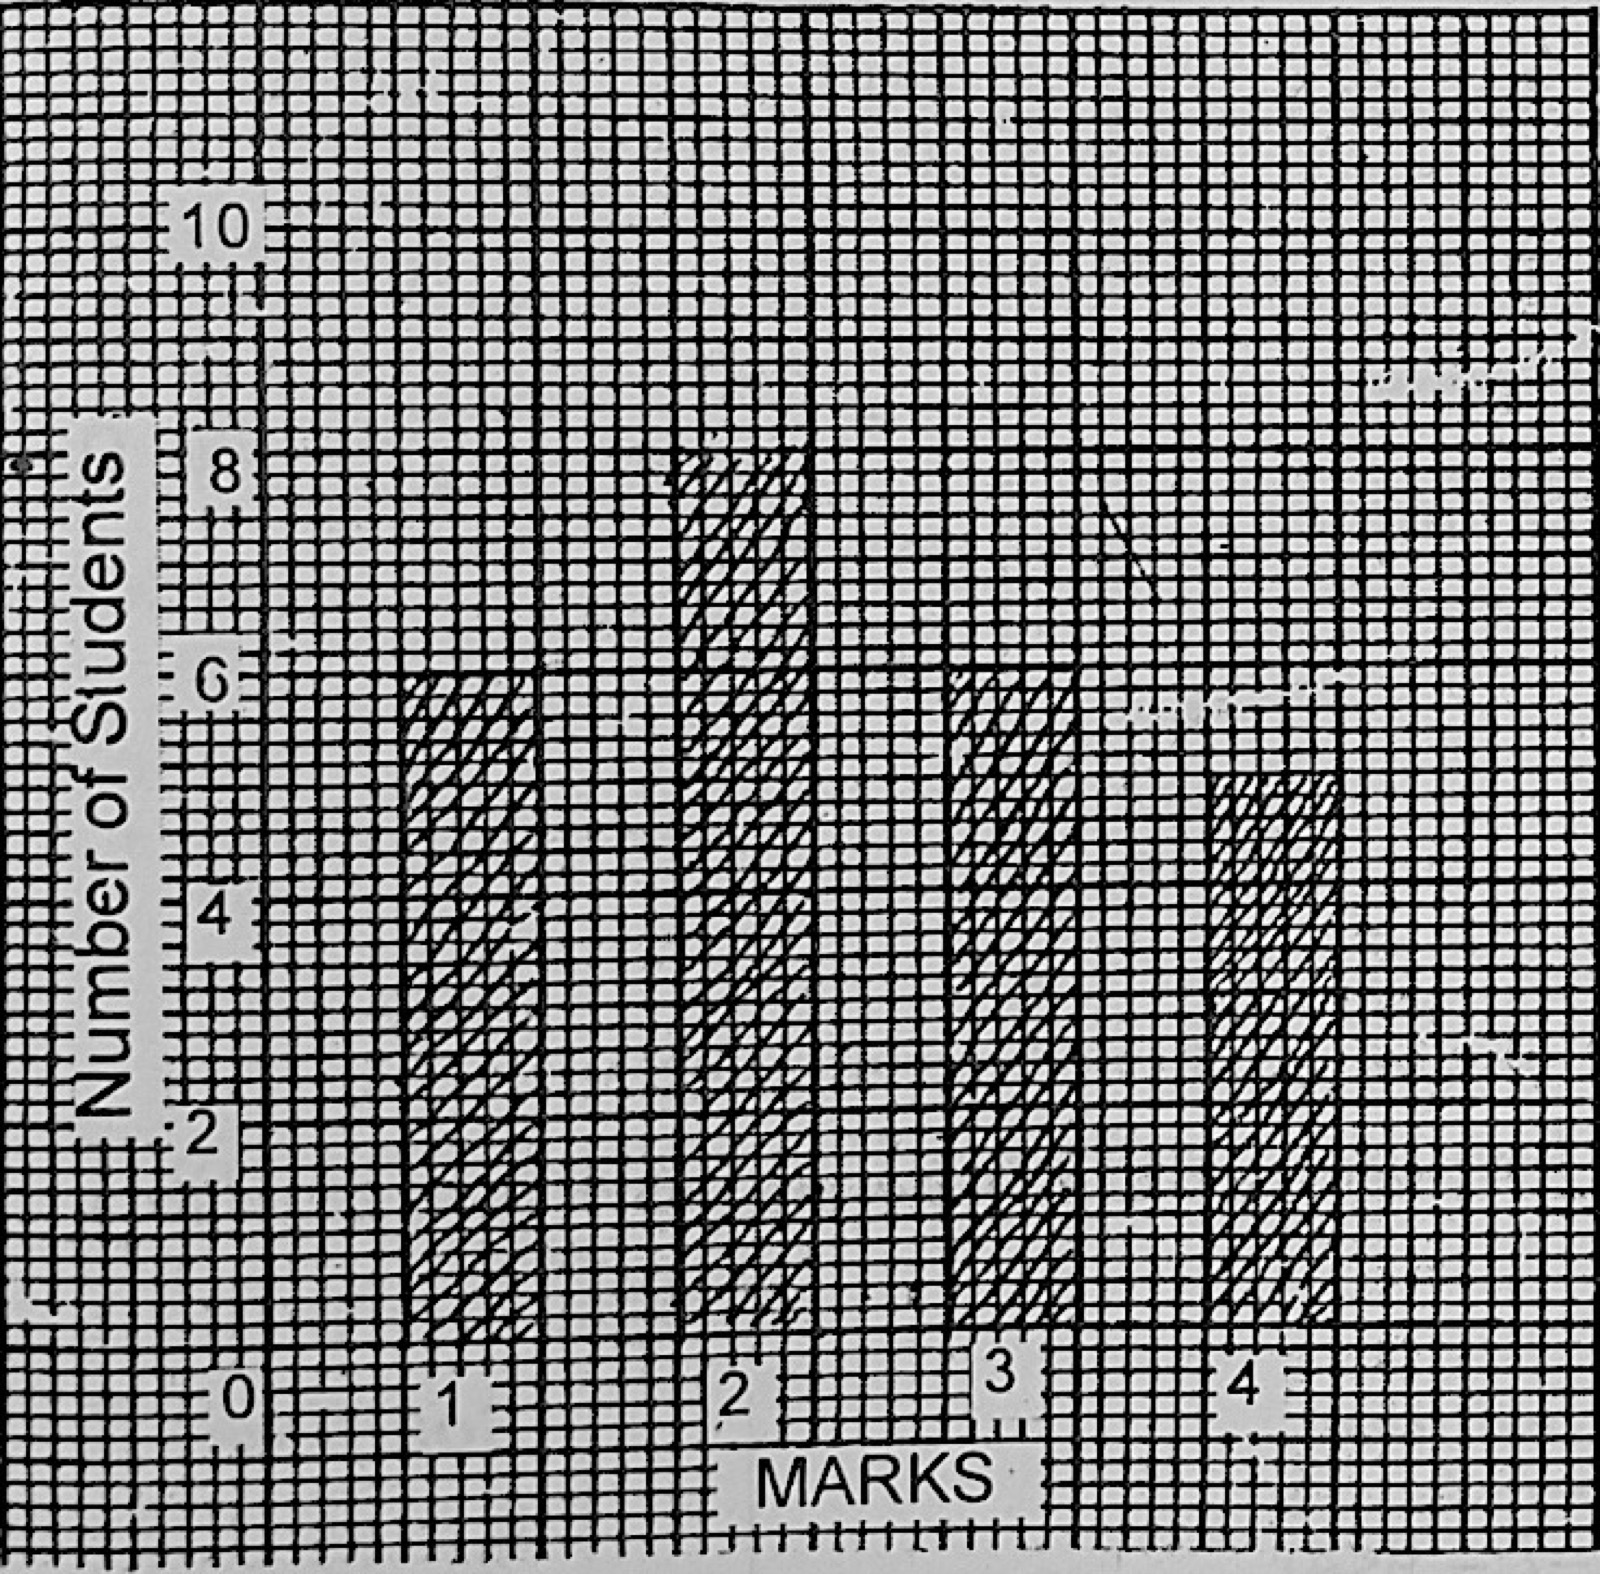
Data PresentationThe bar chart shows the frequency distribution of marks scored by students in a class test. What is the median of the distribution?
- A.2
- B.4
- C.6
- D.8
Show the answer and explanation
Answer: A (2)
Explanation
With 25 students the median is the 13th mark. Cumulative frequencies 6, 14, … so the 13th student scored 2.