Question 29
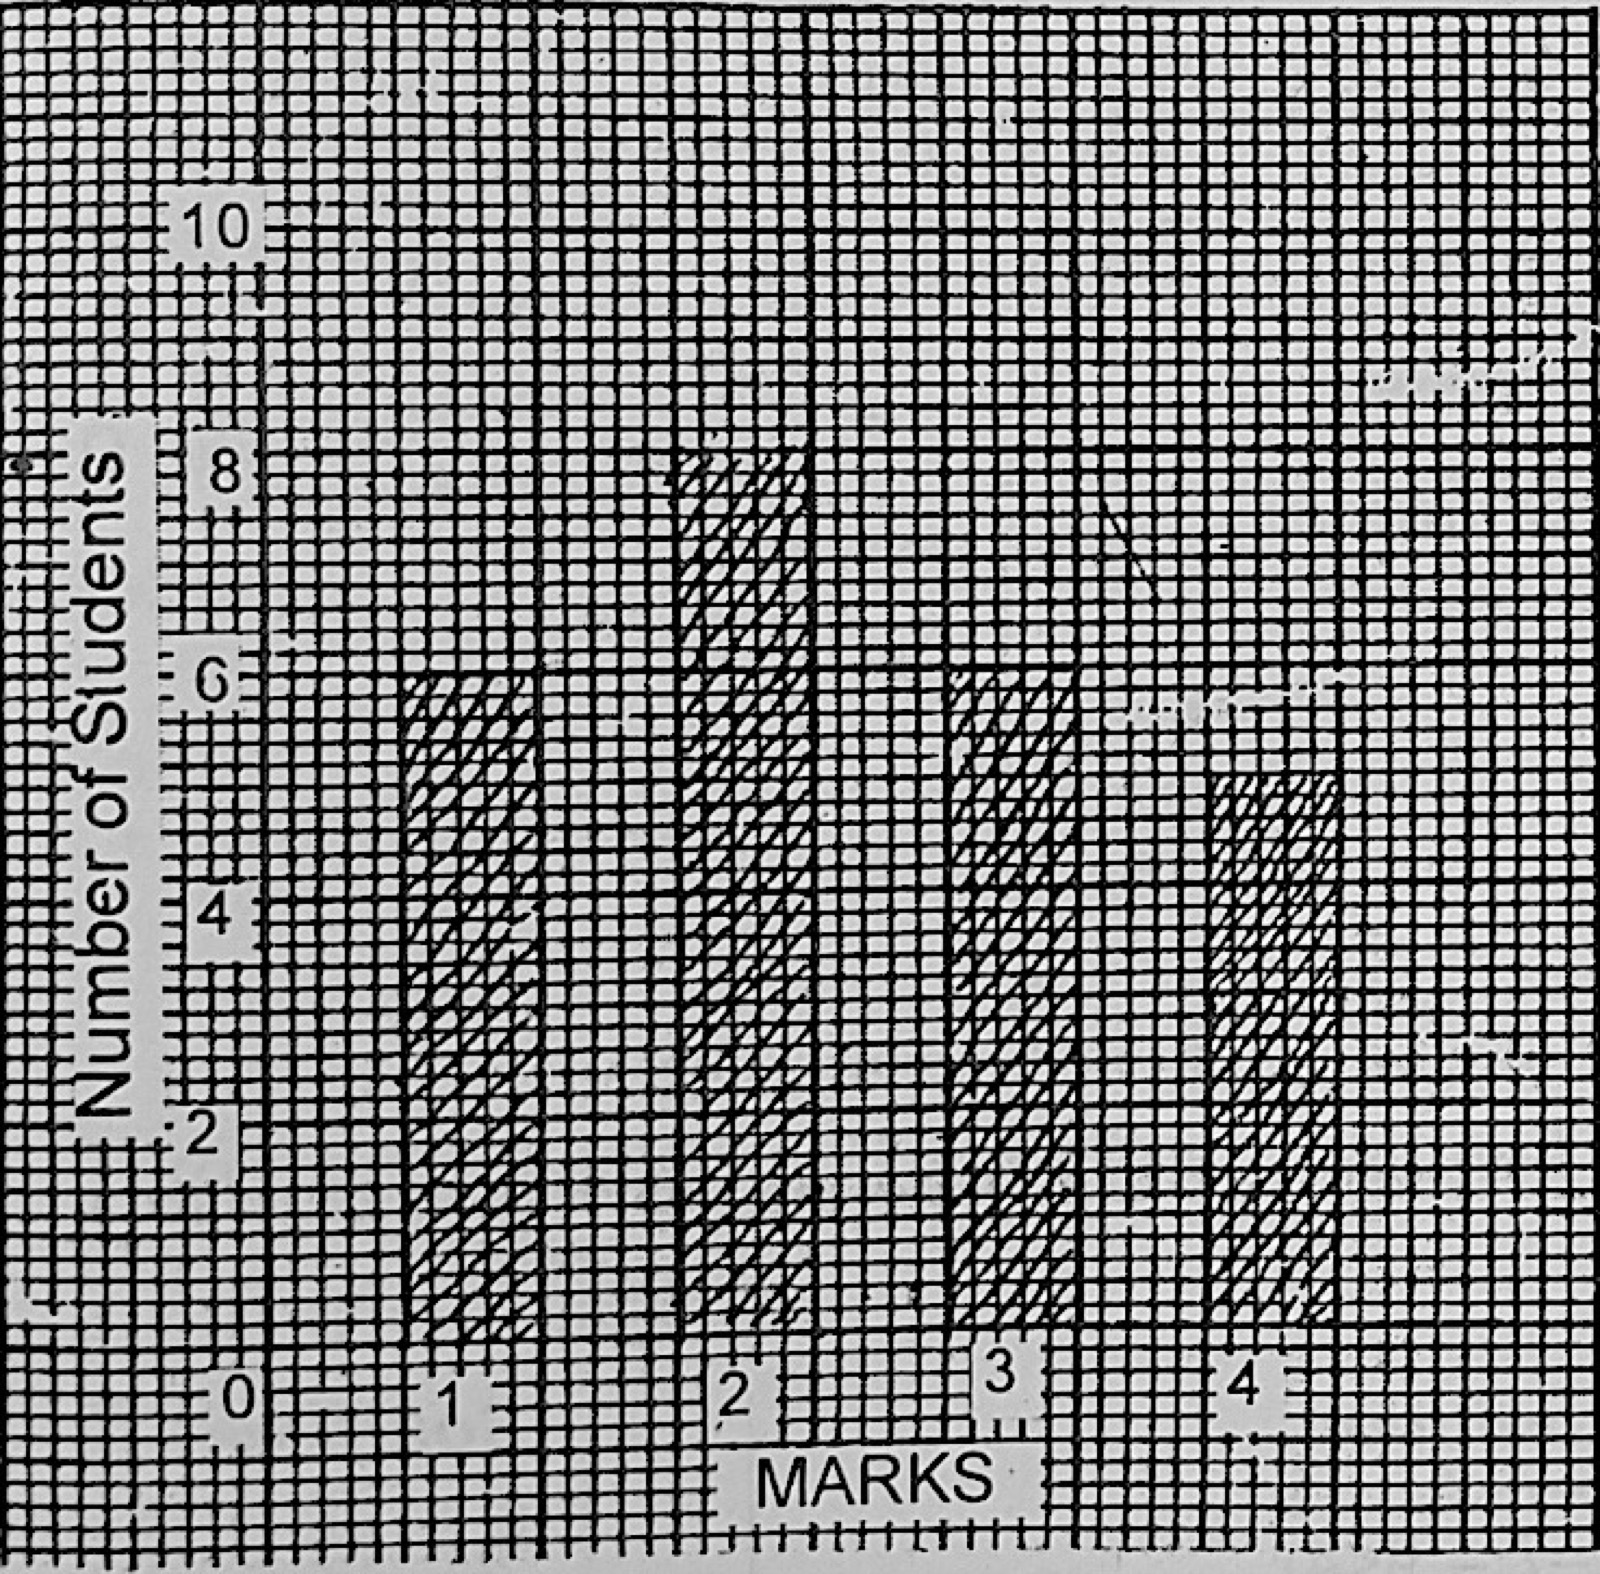
Data PresentationThe bar chart shows the frequency distribution of marks scored by students in a class test. How many students are in the class?
- A.10
- B.24
- C.25
- D.30
Show the answer and explanation
Answer: C (25)
Explanation
Add the bar heights for marks 1, 2, 3, 4: 6 + 8 + 6 + 5 = 25.