Question 44
SetsThe Venn diagram shows the number of students in a class who like reading (R), dancing (D) and swimming (S). How many students like dancing and swimming?
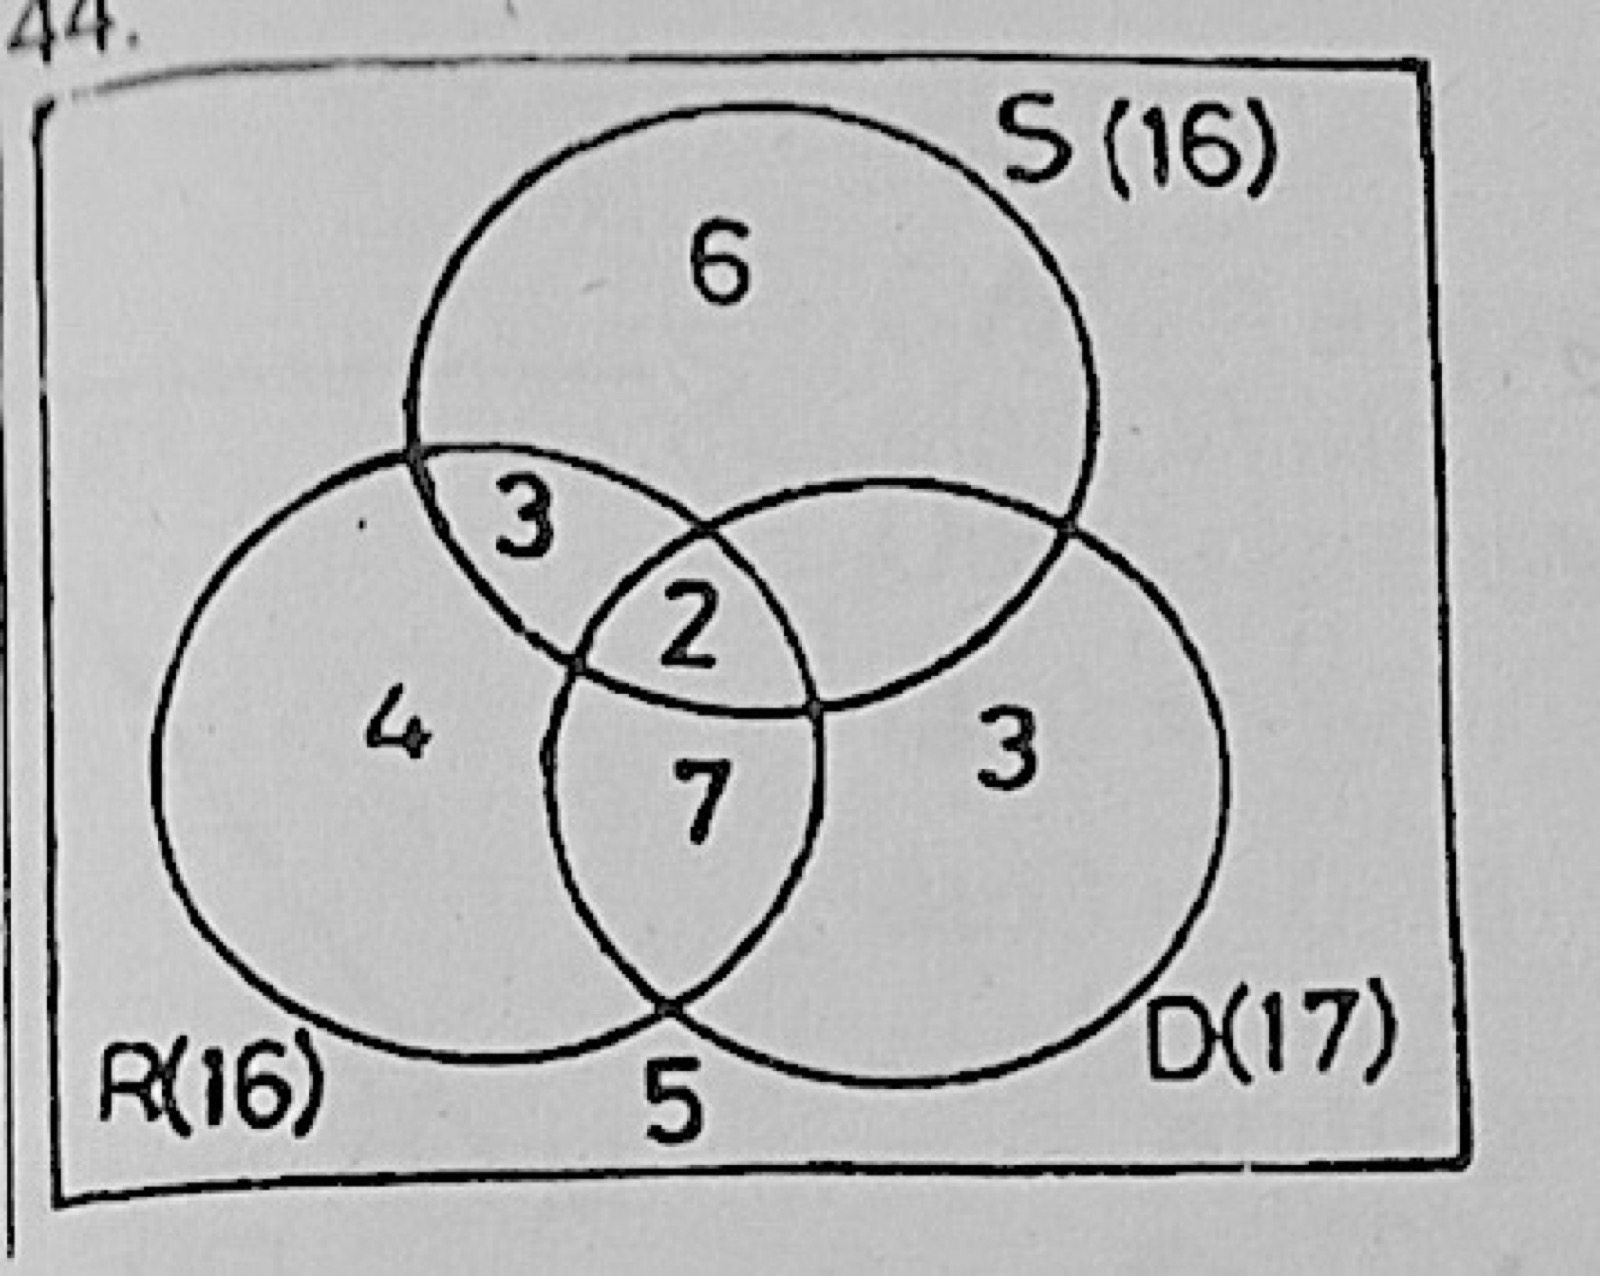
- A.7
- B.9
- C.11
- D.13
Show the answer and explanation
Answer: A (7)
Explanation
S has 16 students: 6 + 3 + 2 + (S and D only) = 16, so S and D only = 5 (the 5 in the diagram). Dancing and swimming = 2 + 5 = 7.