Question 29
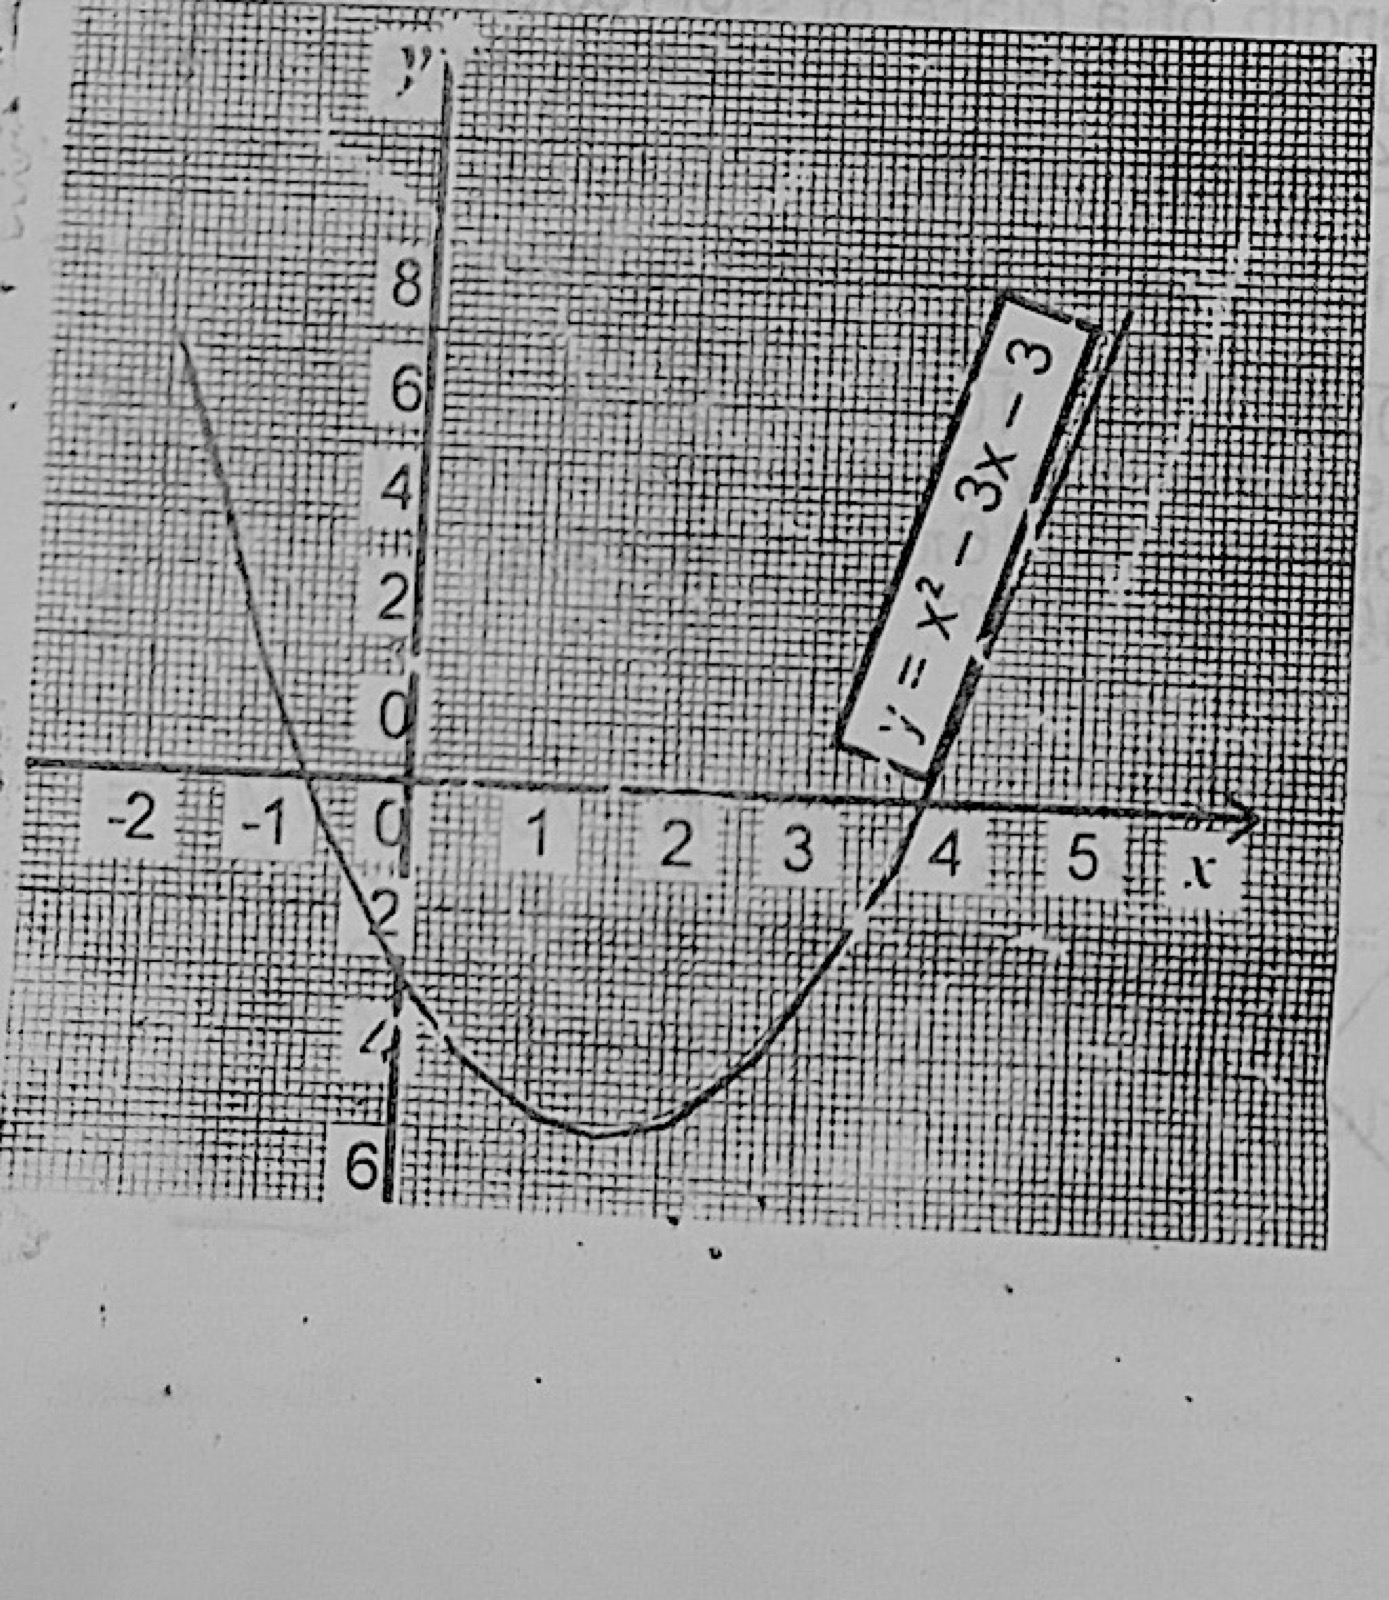
Graphs of FunctionsThe graph represents the relation y = x2 − 3x − 3. Find the values of x for which x2 − 3x = 7.
- A.−1.55, 4.55
- B.1.55, −4.55
- C.−1.55, −4.55
- D.1.55, 4.55
Show the answer and explanation
Answer: A (−1.55, 4.55)
Explanation
x2 − 3x = 7 means x2 − 3x − 3 = 4, so read where the curve meets y = 4: x ≈ −1.55 and 4.55 (exactly (3 ± √37)/2).