Question 5
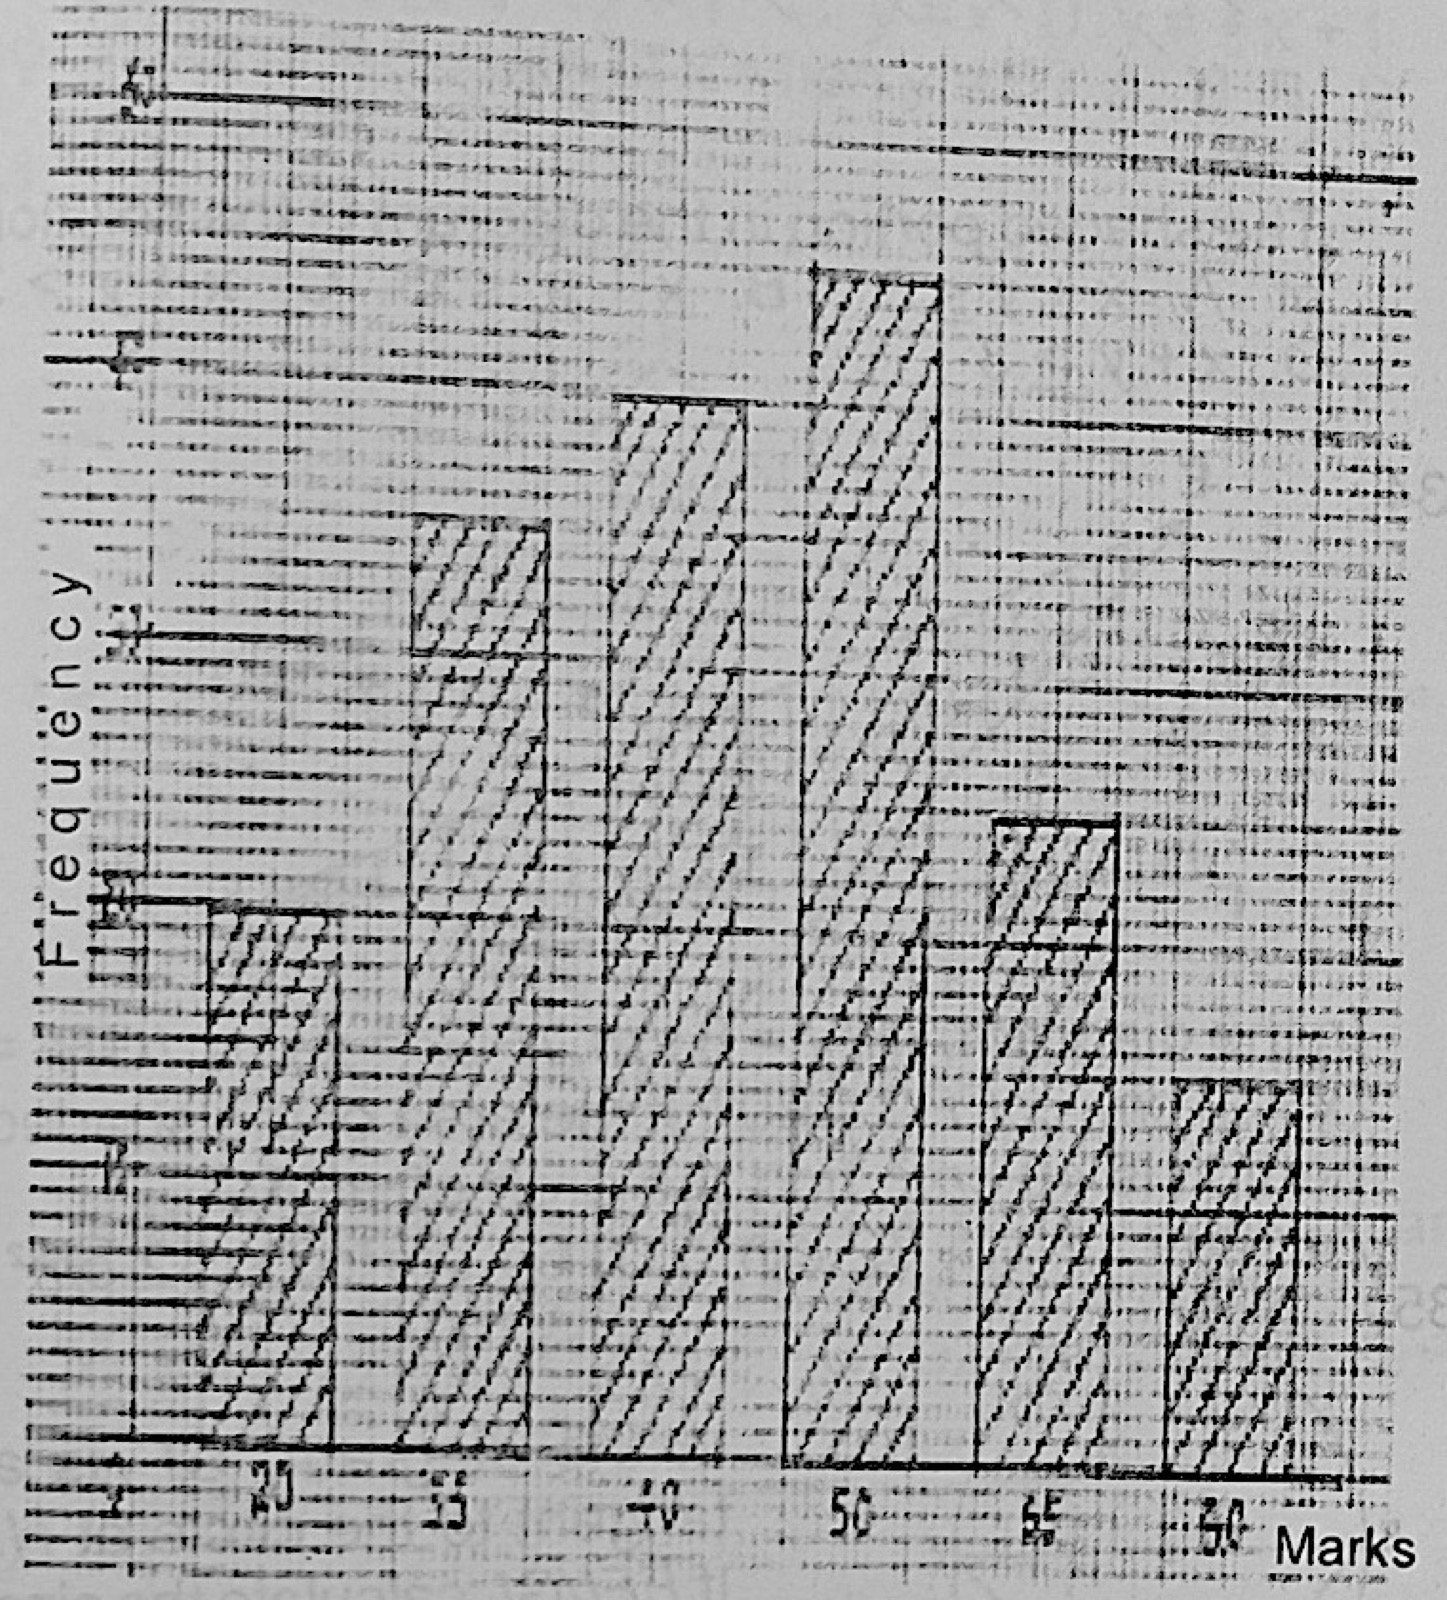
Data PresentationThe bar chart shows the marks distribution in an English test. What percentage of the students had marks ranging from 35 to 50?
- A.55⅓%
- B.60%
- C.65%
- D.66⅔%
Show the answer and explanation
Answer: D (66⅔%)
Explanation
Total = 20 + 35 + 40 + 45 + 25 + 15 = 180. Marks 35 to 50: 35 + 40 + 45 = 120. 120/180 × 100% = 66⅔%.