Question 41
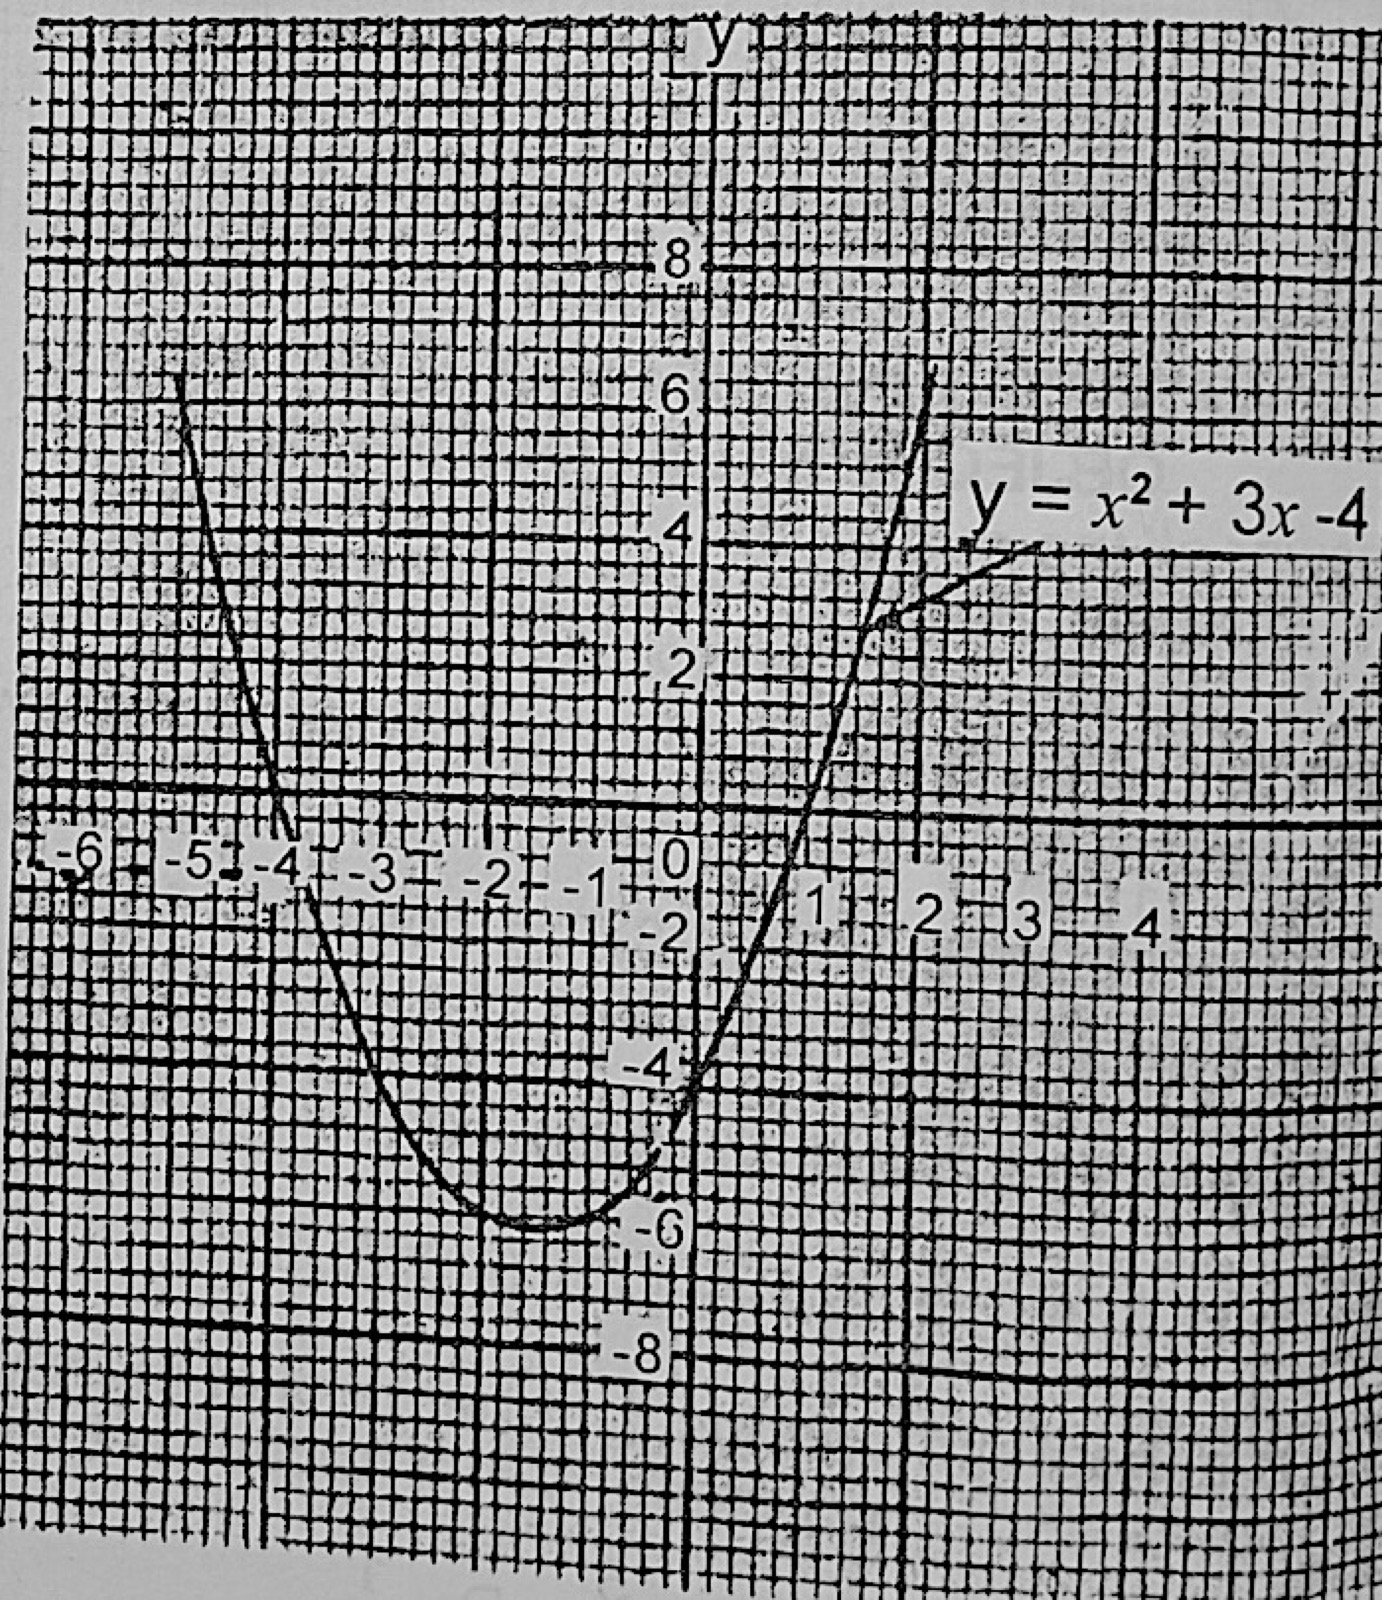
Graphs of FunctionsUse the graph of y = x2 + 3x − 4. The values of x when y = 3 are approximately
- A.−4.7 and 1.4
- B.−4.6 and 1.5
- C.−3.6 and 0.4
- D.−3.6 and 1.5.
Show the answer and explanation
Answer: B (−4.6 and 1.5)
Explanation
Draw y = 3 across the graph; it meets the curve at about −4.6 and 1.5 (x2 + 3x − 7 = 0).