Question 8
Graphs of FunctionsThe diagram is the graph of y = 6 + x − x2. The graph intercepts the x-axis at P and R and the y-axis at Q. What is the value of y at Q?
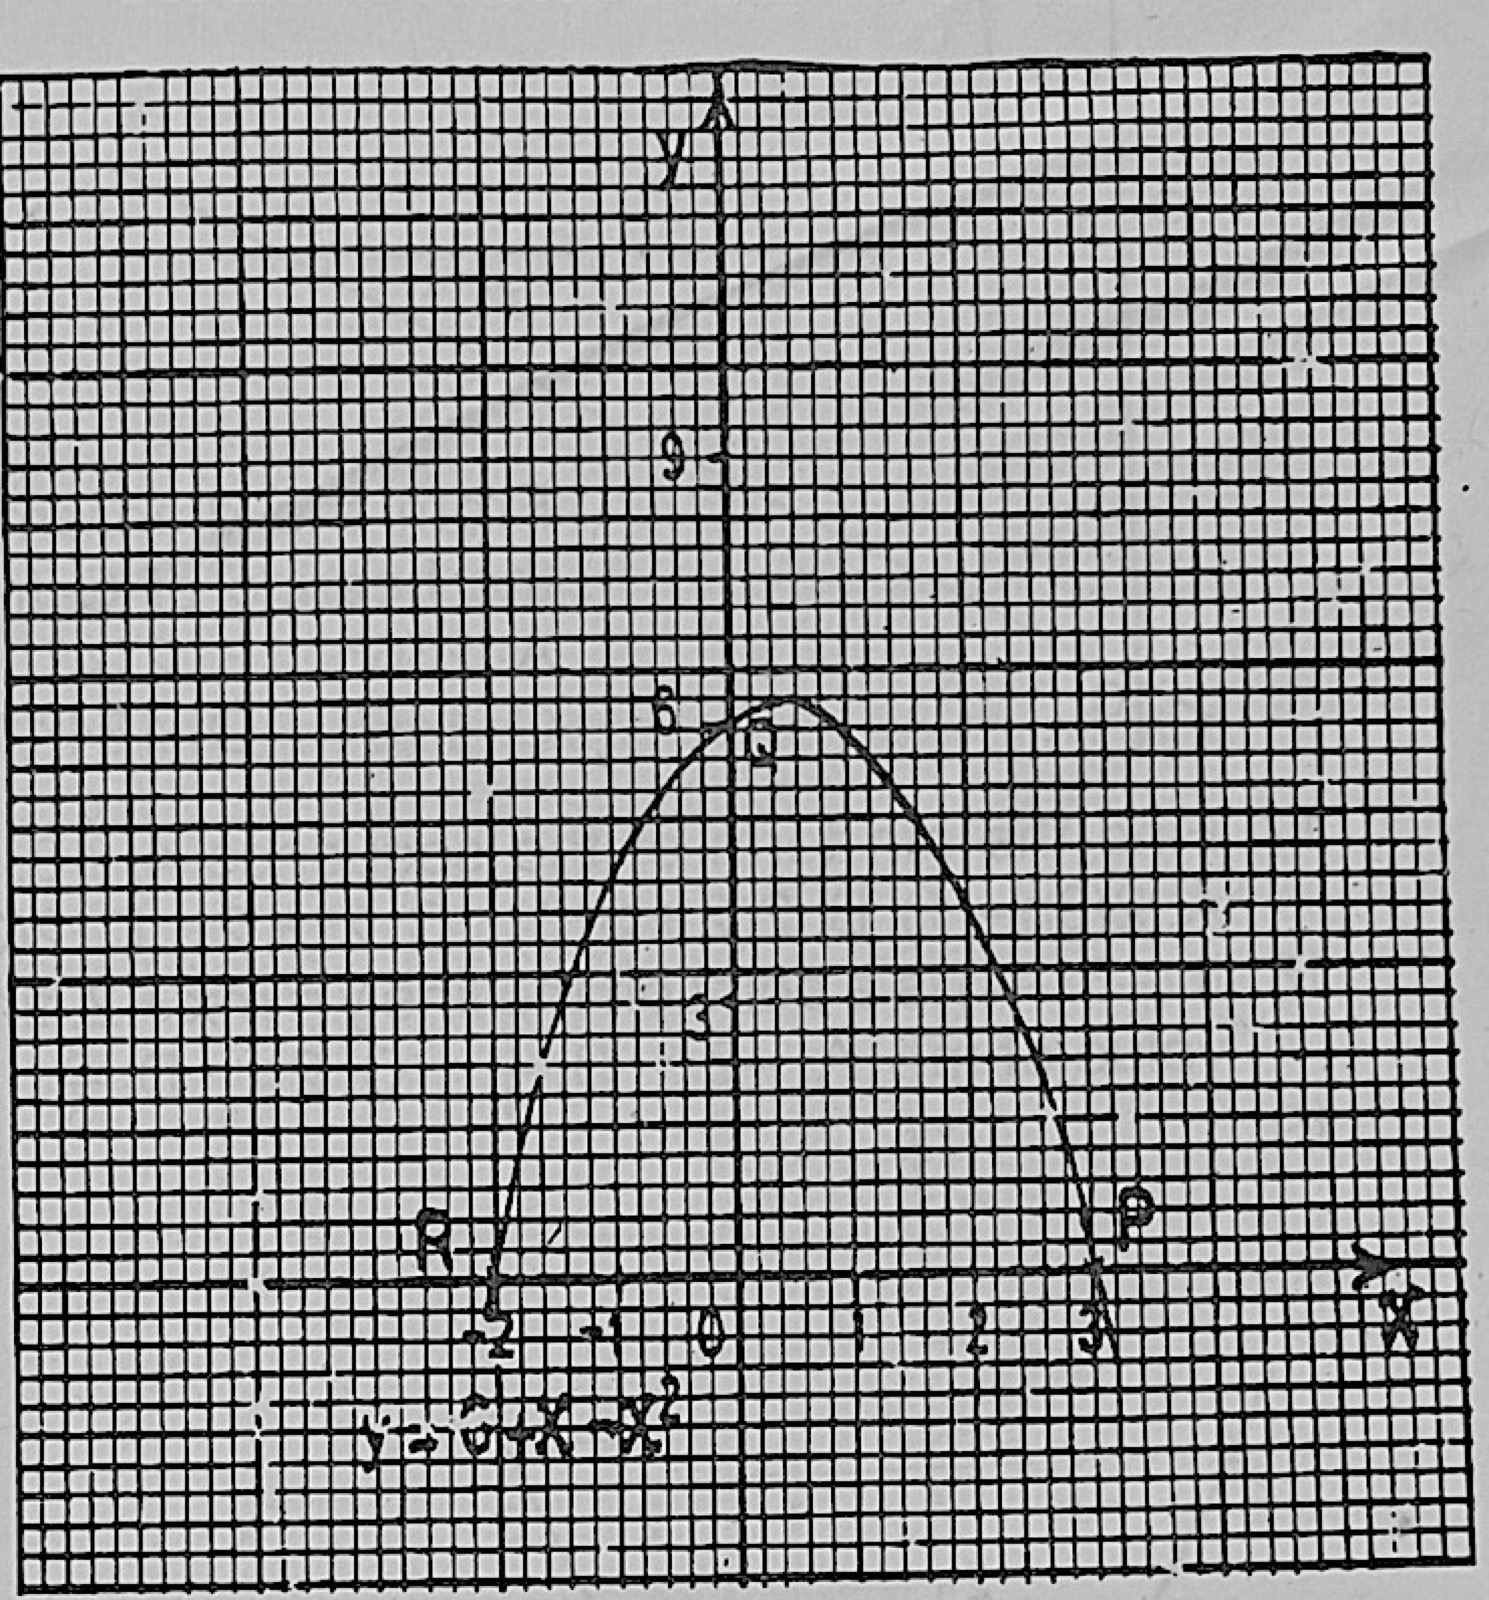
- A.6 1/3
- B.6
- C.3
- D.0
Show the answer and explanation
Answer: B (6)
Explanation
At the y-axis x = 0, so y = 6 + 0 − 0 = 6.