Question 19
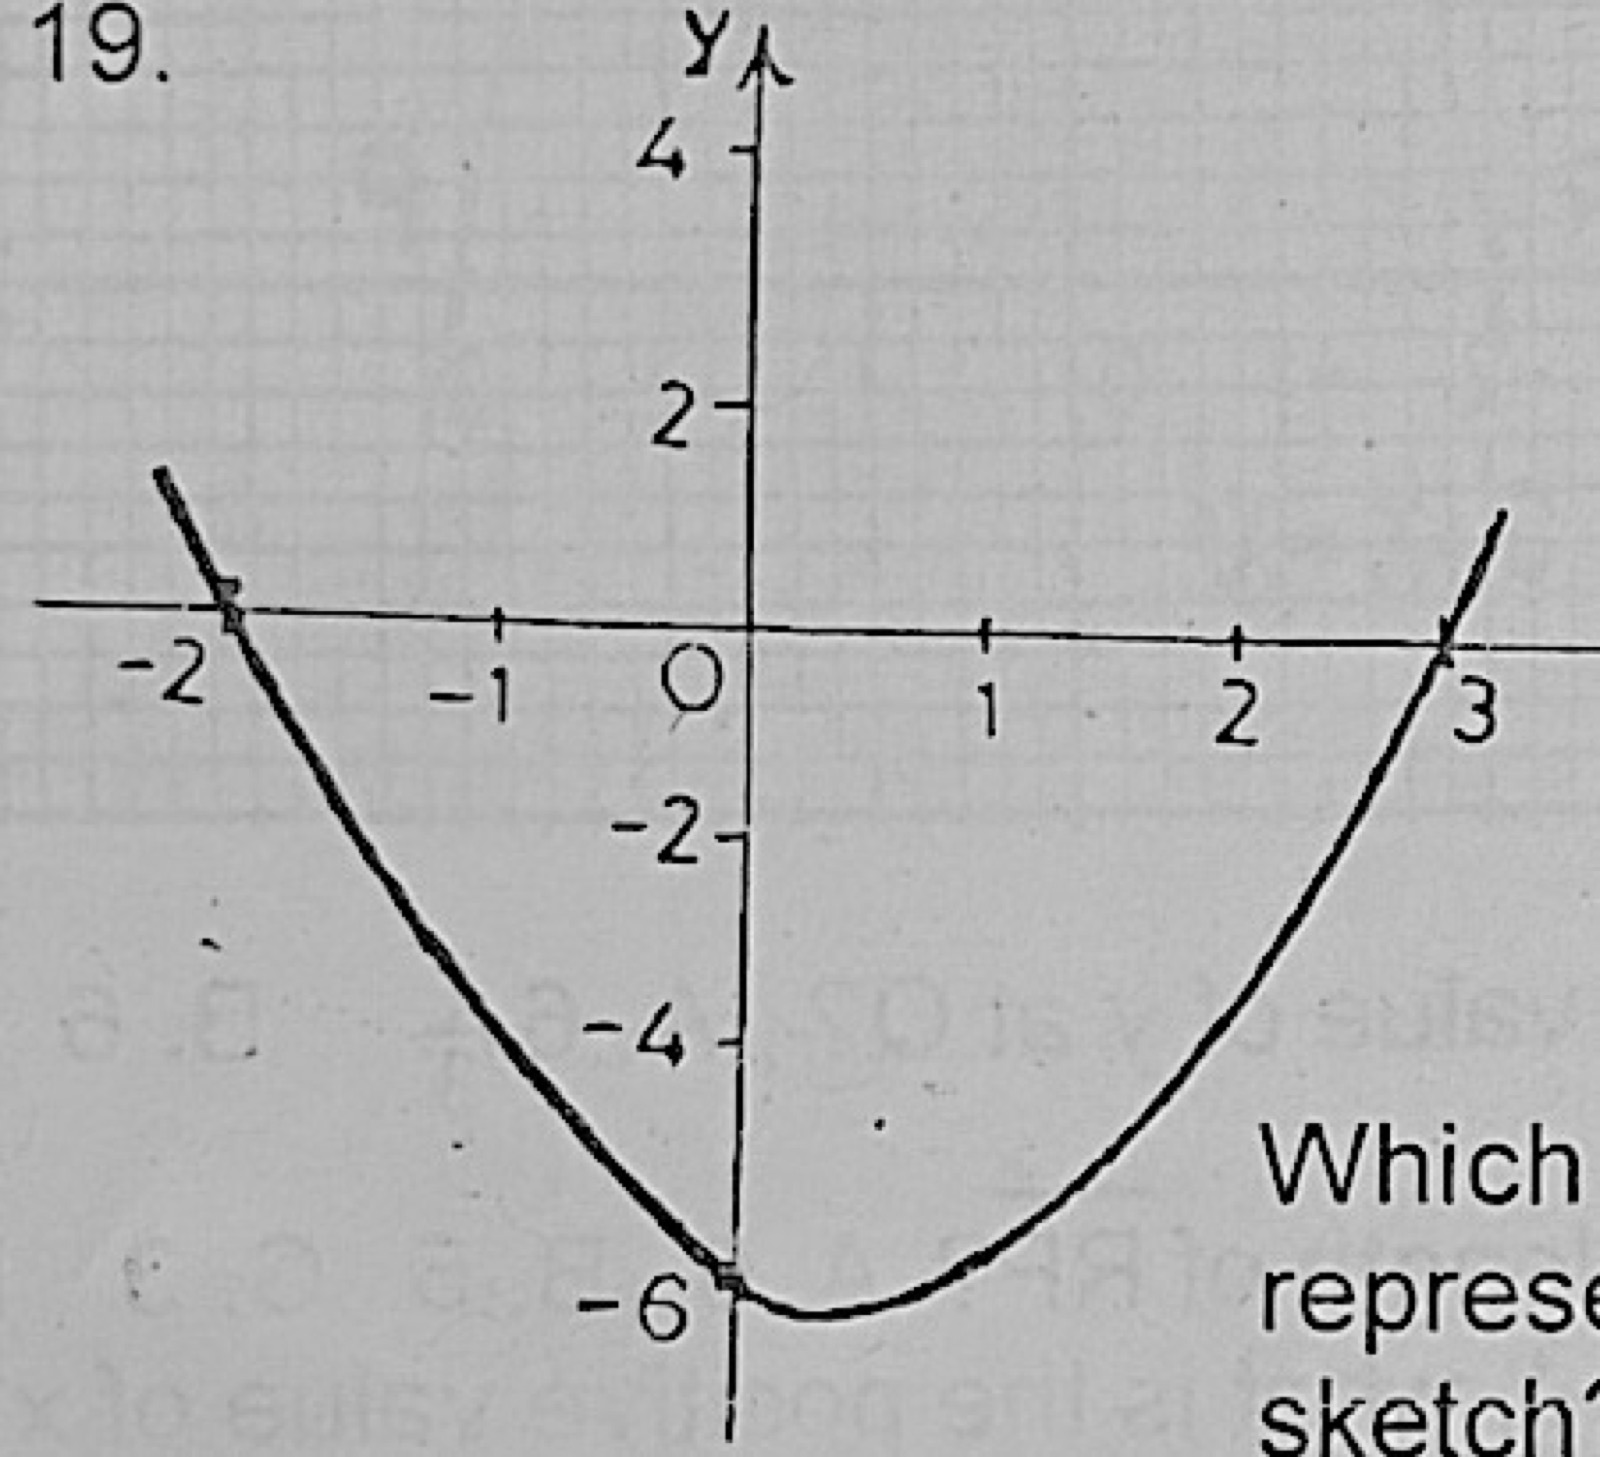
Graphs of FunctionsWhich of the following is represented by the above sketch?
- A.y = x2 + x − 6
- B.y = x2 − x − 6
- C.y = x2 − x + 6
- D.y = x2 + x + 6
Show the answer and explanation
Answer: B (y = x2 − x − 6)
Explanation
The curve cuts the x-axis at −2 and 3: y = (x + 2)(x − 3) = x2 − x − 6 (and y = −6 at x = 0).