Question 10
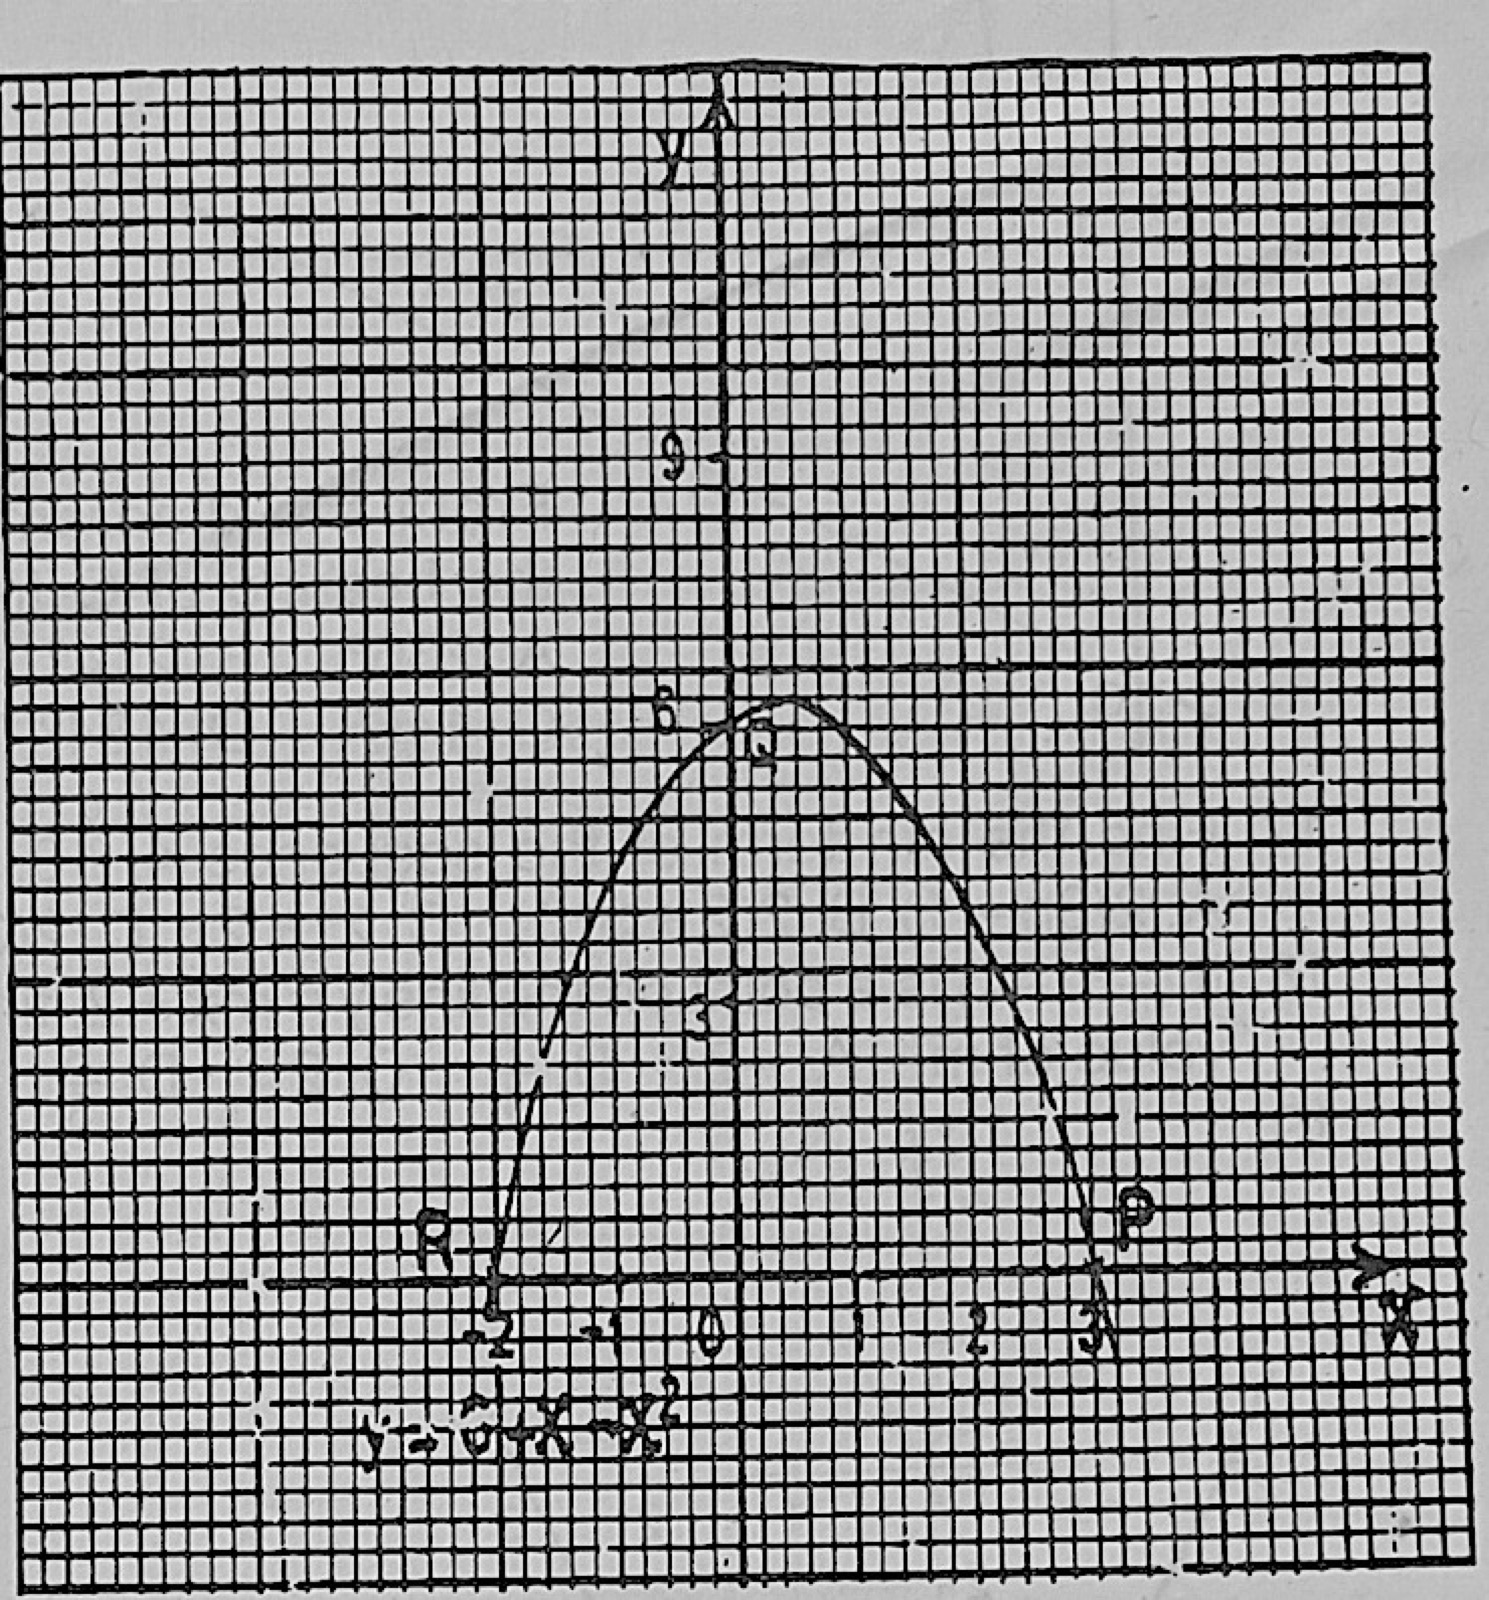
Graphs of FunctionsThe diagram is the graph of y = 6 + x − x2. When y = 3 1/2, what is the positive value of x?
- A.2 1/2
- B.2 1/5
- C.1 1/5
- D.0
Show the answer and explanation
Answer: B (2 1/5)
Explanation
Solve 6 + x − x2 = 3.5: x2 − x − 2.5 = 0 gives x ≈ 2.16, which reads as about 2 1/5 on the graph.