Question 33
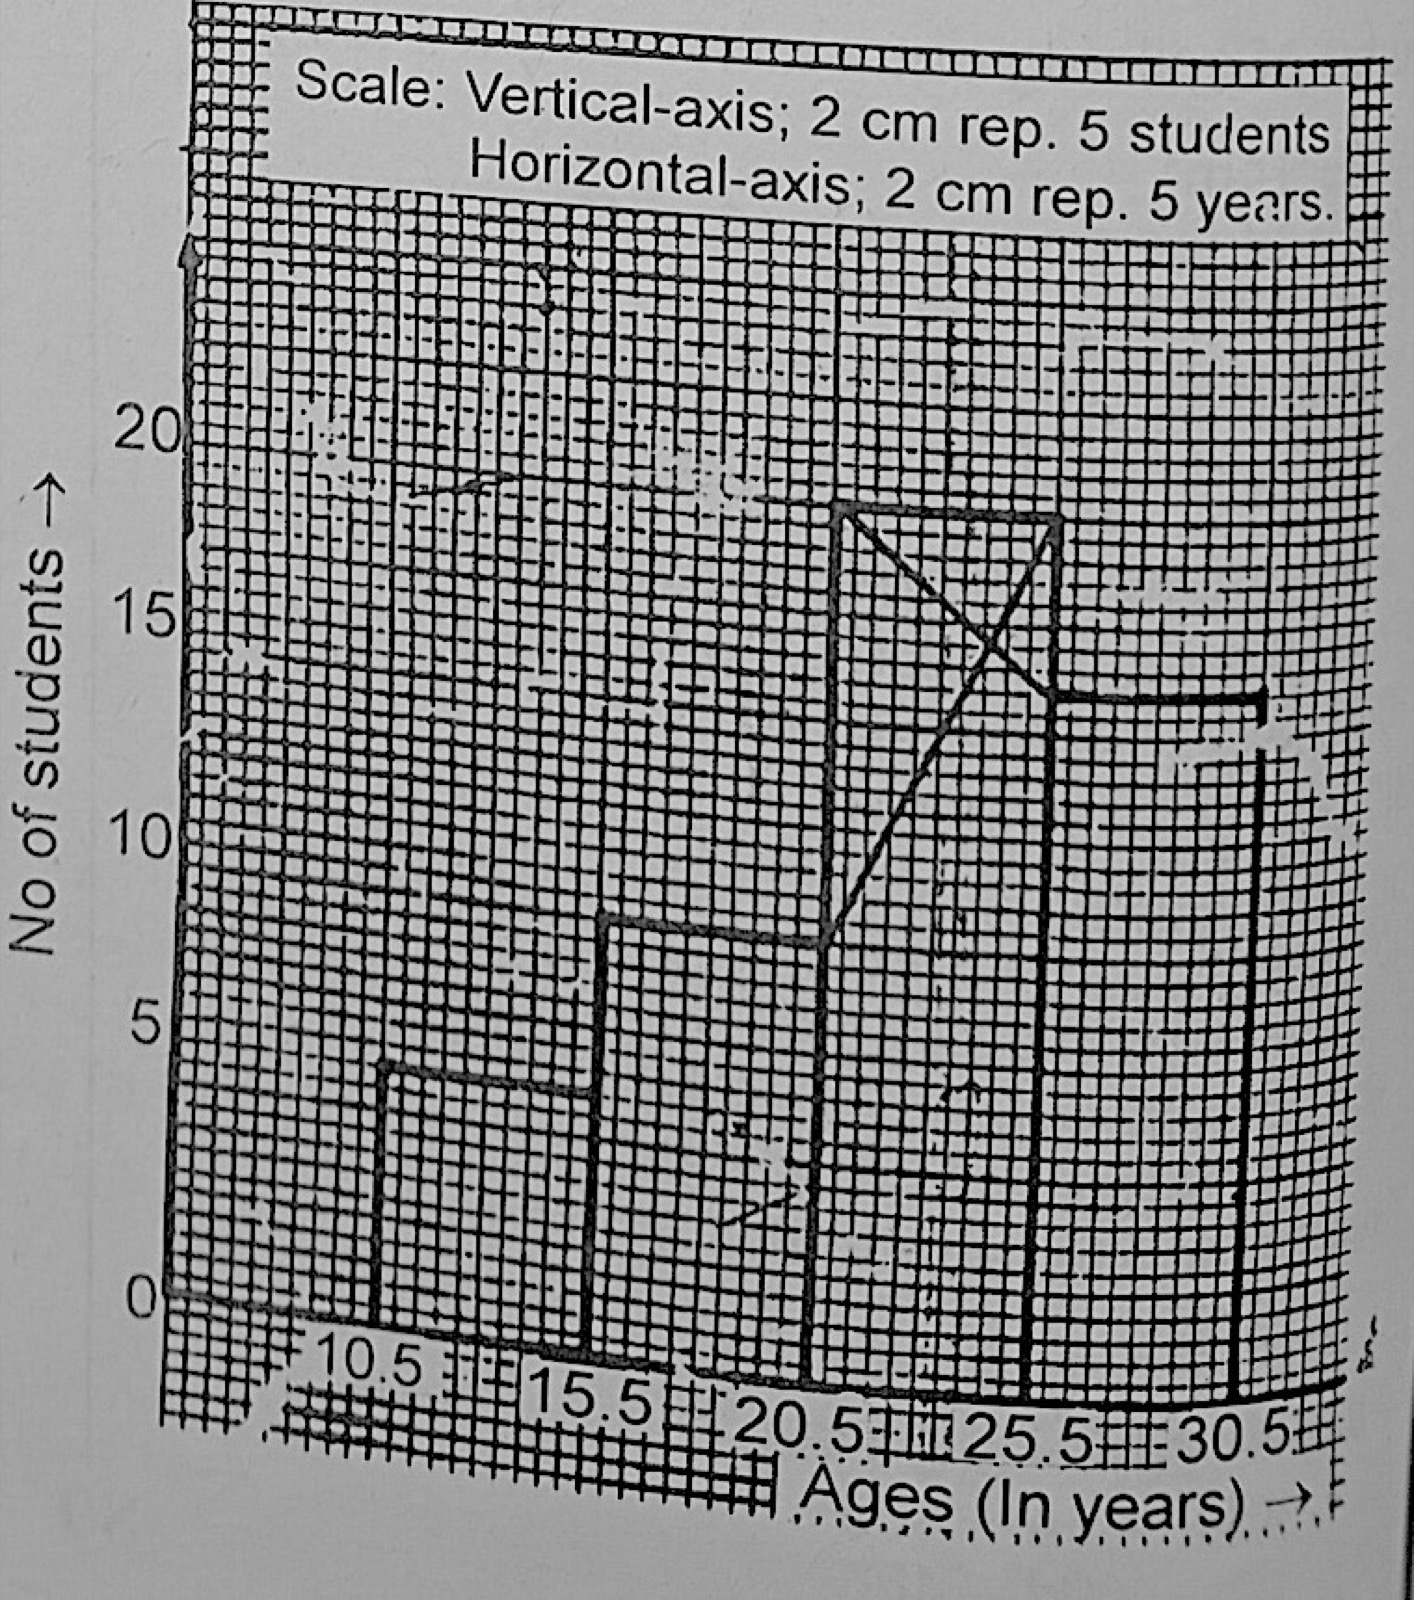
Measures of DispersionThe histogram shows the distribution of a group of students according to their ages. What is the range of their ages?
- A.14 years
- B.20 years
- C.30.5 years
- D.31 years
Show the answer and explanation
Answer: B (20 years)
Explanation
The ages run from 10.5 to 30.5 years on the histogram, so the range is 30.5 − 10.5 = 20 years.