Theory question 110
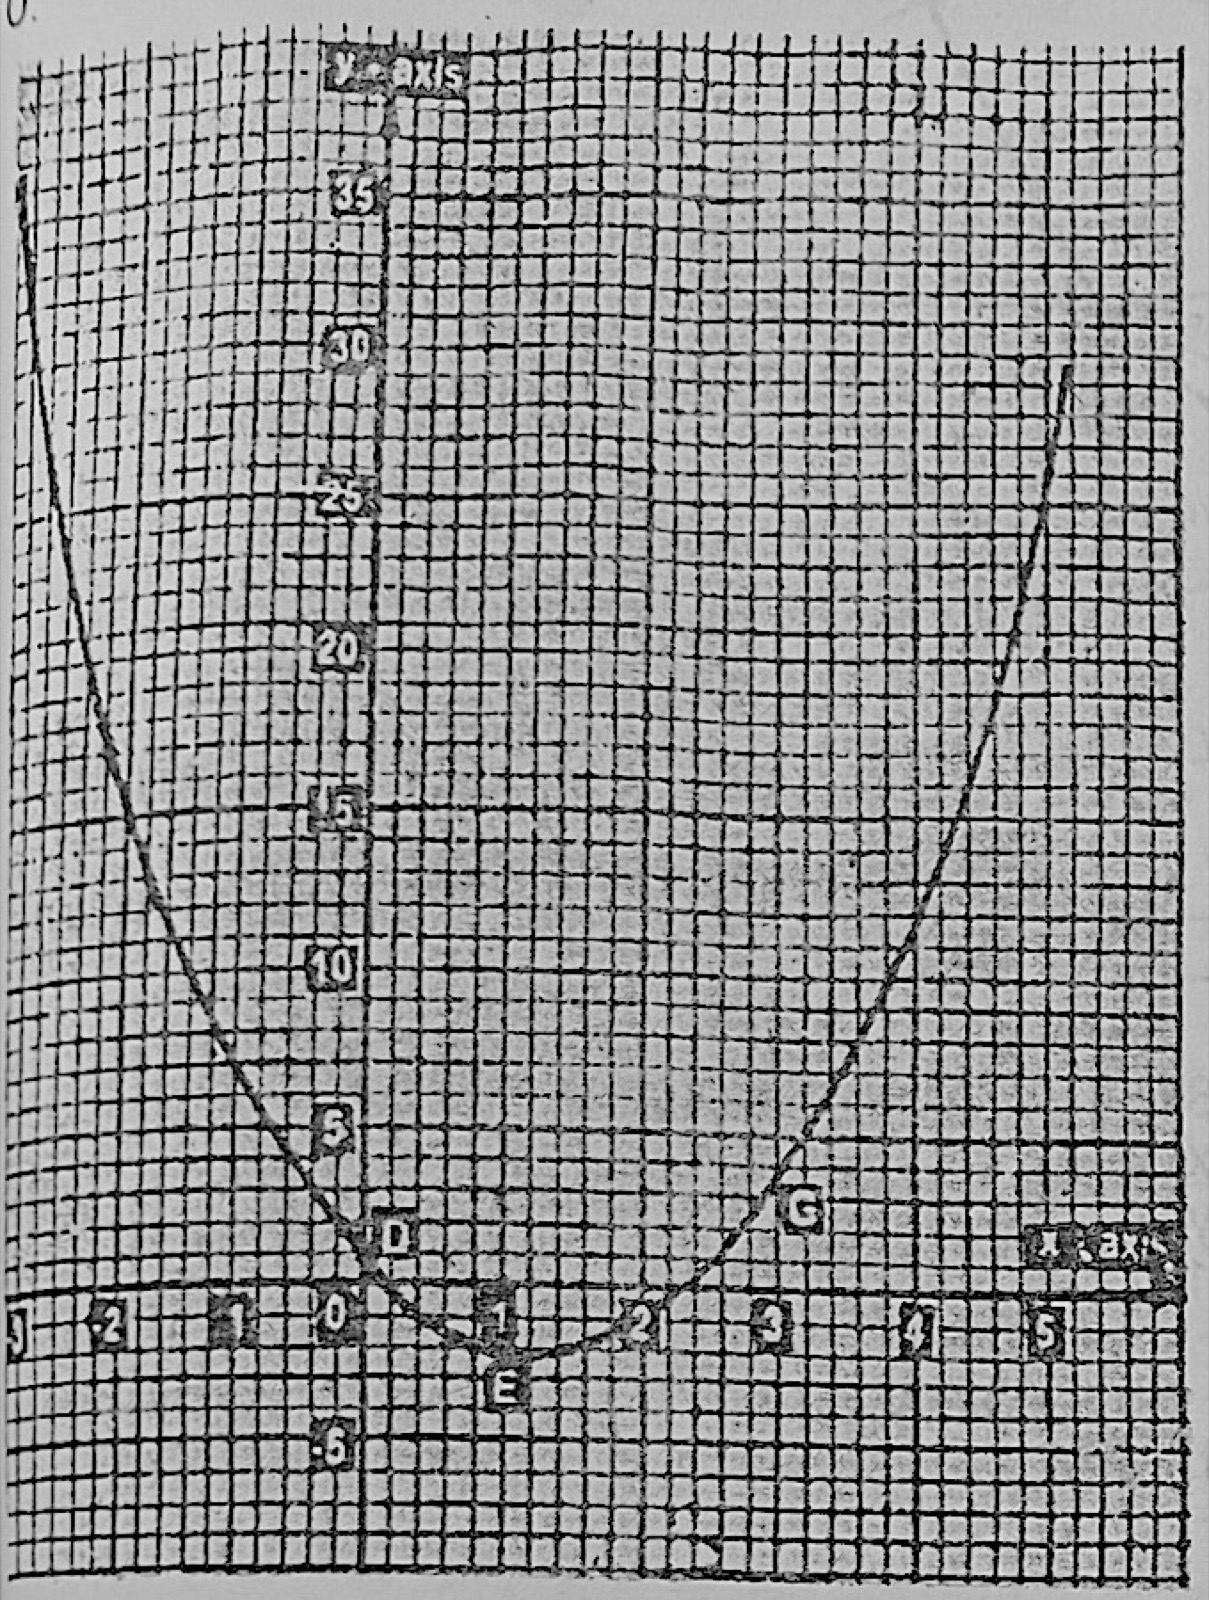
Graphs of FunctionsAbove is the graph of the quadratic function y = ax2 + bx + c where a, b and c are constants. Using the graph, find: (a)(i) The scales on both axis; (ii) The equation of the line of symmetry of the curve; (iii) The roots of the quadratic equation ax2 + bx + c = 0. (b) Use the coordinates of points D, E and G to find the values of the constants a, b, and c and hence write down the quadratic function illustrated in the graph. (c) Find the greatest value of y within the range −3 ≤ x ≤ 5.
Show the model answer
(a)(i) Read the scales from the grid: about 2 cm to 1 unit on the x-axis and 2 cm to 5 units on the y-axis.
(ii) The curve is lowest at about x = 1.25, so the line of symmetry is x = 1.25 (accept 1.2–1.3).
(iii) The curve cuts the x-axis at about x = 0.2 and x = 2.3.
(b) From the graph D = (0, 1), E = (1, −2), G = (3, 4).
D: c = 1. E: a + b + 1 = −2, so a + b = −3. G: 9a + 3b + 1 = 4, so 3a + b = 1.
Subtract: 2a = 4, a = 2, b = −5. y = 2x2 − 5x + 1.
(c) In −3 ≤ x ≤ 5 the greatest value is at x = −3: y = 18 + 15 + 1 = 34.
Substitute each point into y = ax² + bx + c to get three equations.