Question 44
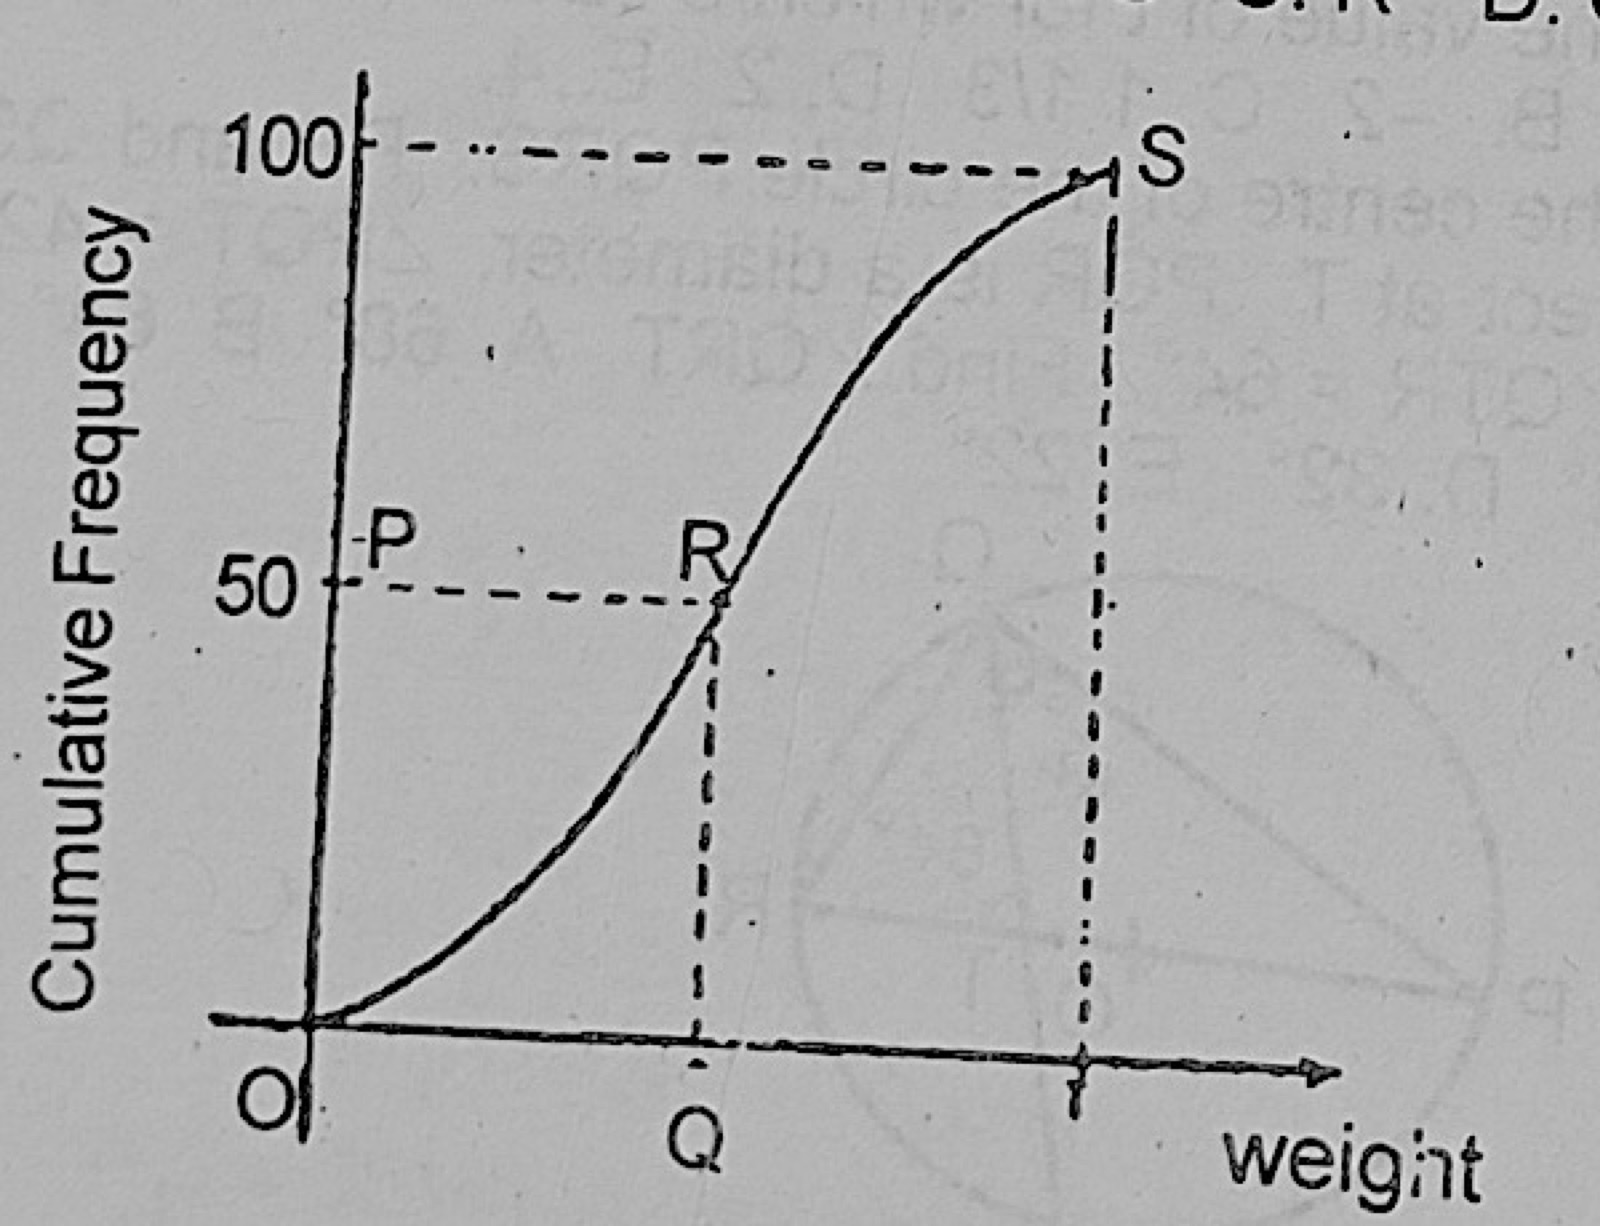
Data PresentationThe graph is the cumulative frequency curve for the weight distribution of 100 workers in a factory. Which of the points P, Q, R, S and T indicates the median weight?
- A.T
- B.S
- C.R
- D.Q
- E.P.
Show the answer and explanation
Answer: D (Q)
Explanation
The median is the weight at half the total frequency (50). Go across from 50 to the curve at R and down to the weight axis at Q.