Question 20
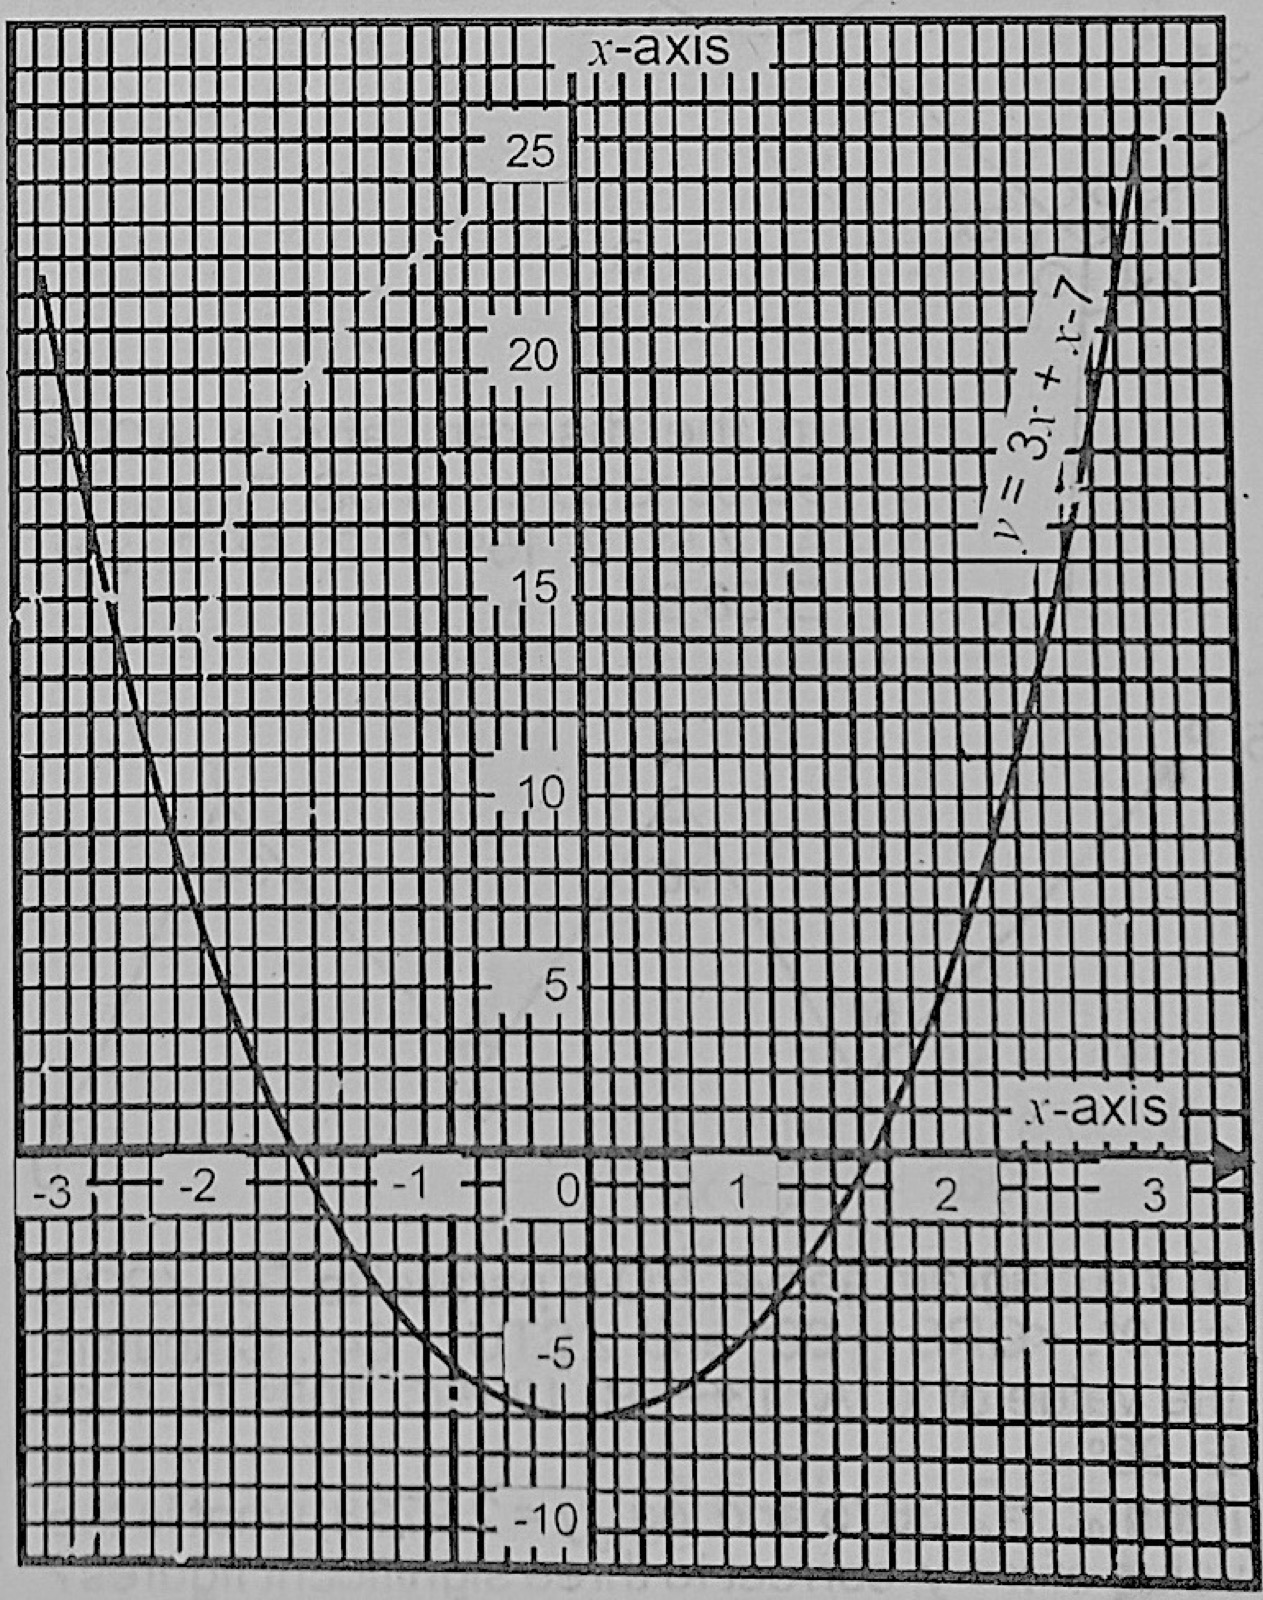
Graphs of FunctionsUse the graph of y = 3x2 + x − 7 to answer this question. What is the minimum value of y?
- A.−10
- B.−7
- C.−4
- D.−1
- E.2.
Show the answer and explanation
Answer: B (−7)
Explanation
The lowest point of the curve is just below the y-axis at about y = −7 (exactly −7 1/12 at x = −1/6).