Question 43
Measures of Central TendencyThe diagram below shows the distribution of marks for a class test. How many students took the examination?
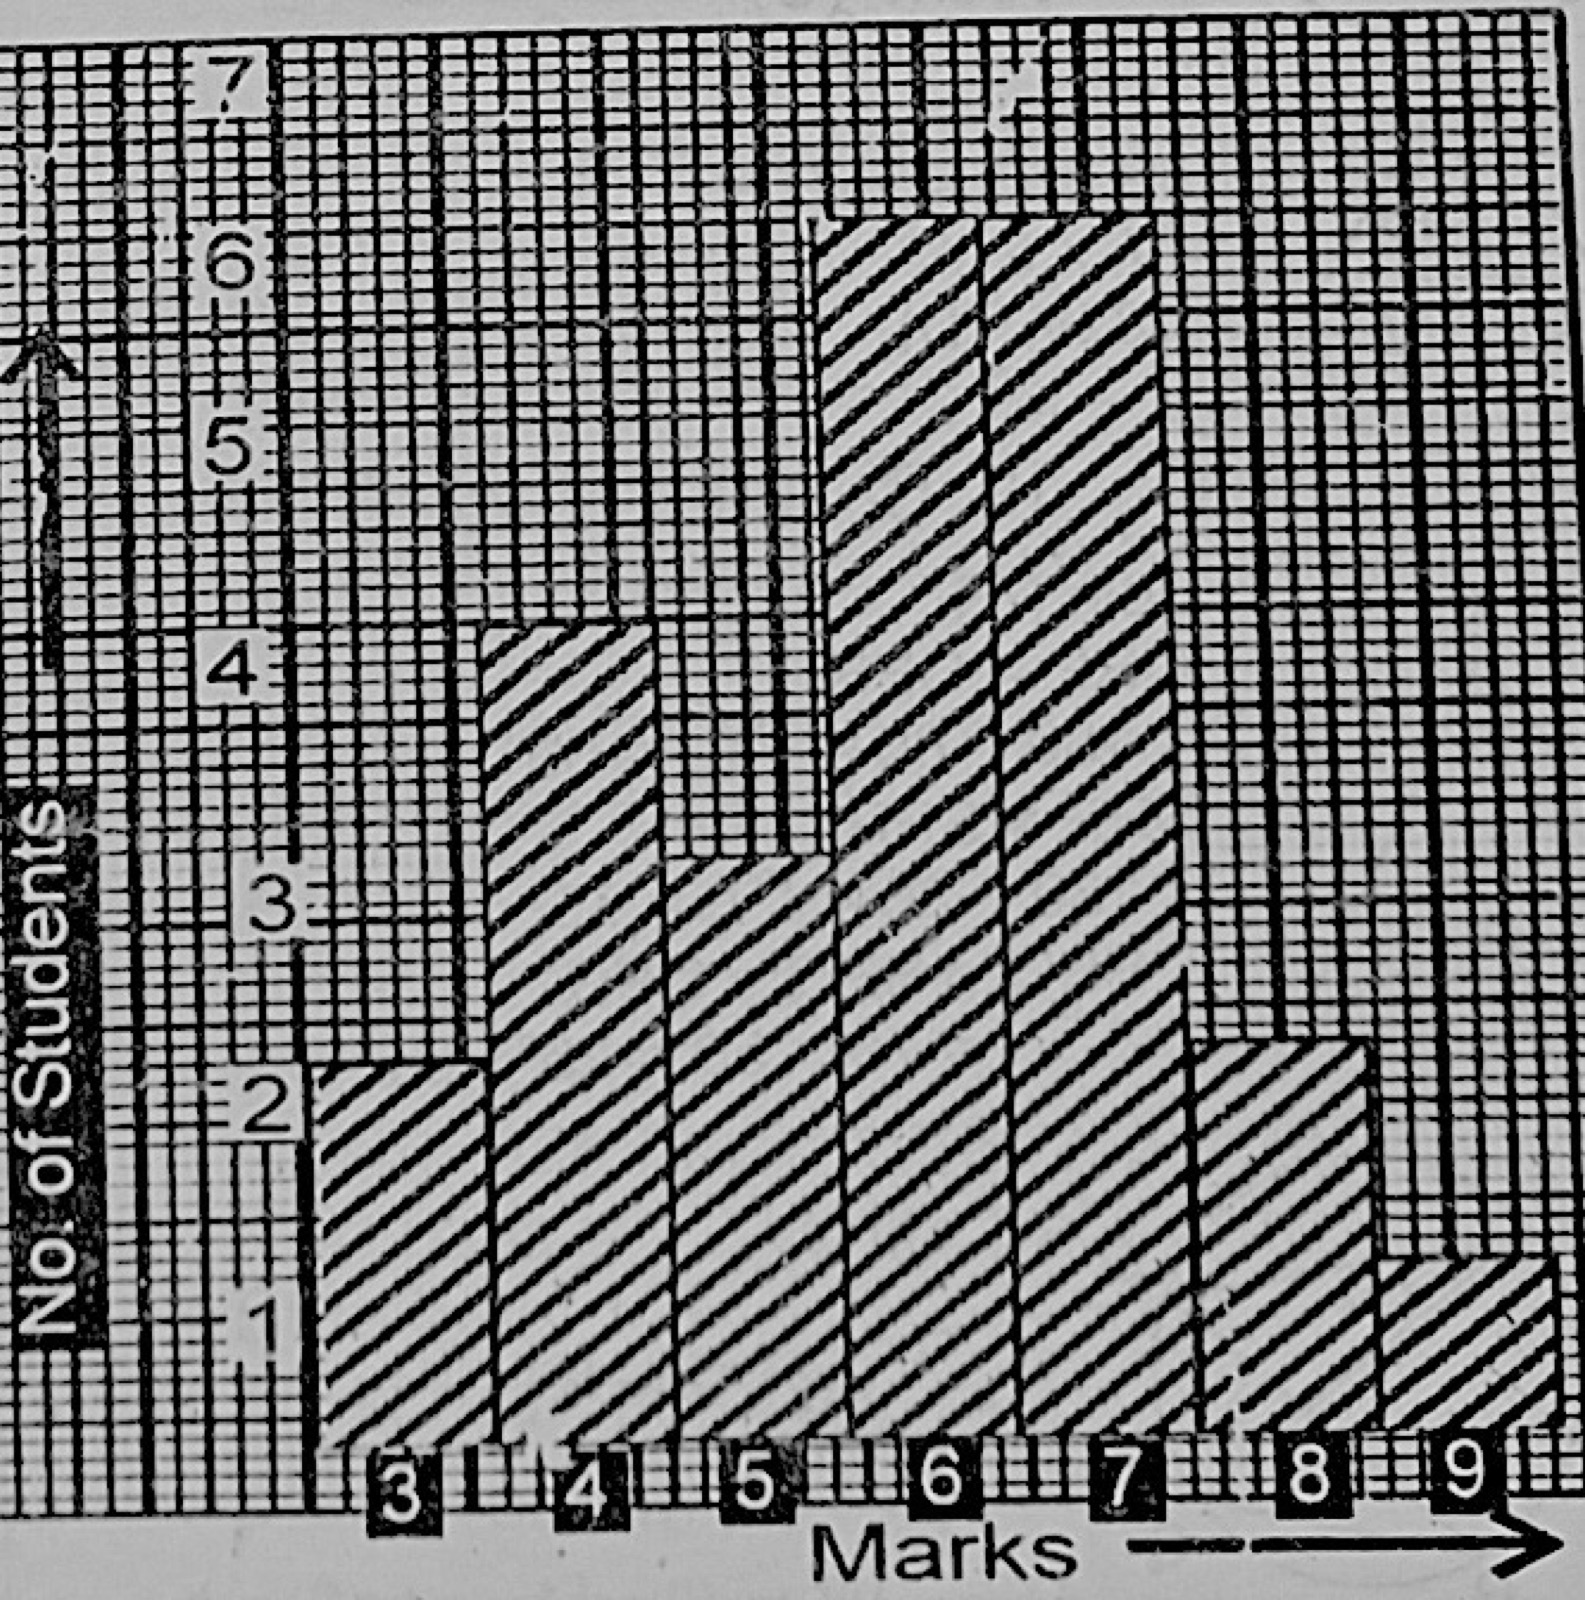
- A.18
- B.20
- C.21
- D.23
- E.24
Show the answer and explanation
Answer: E (24)
Explanation
Add the bar heights for marks 3 to 9: 2 + 4 + 3 + 6 + 6 + 2 + 1 = 24.