Question 11
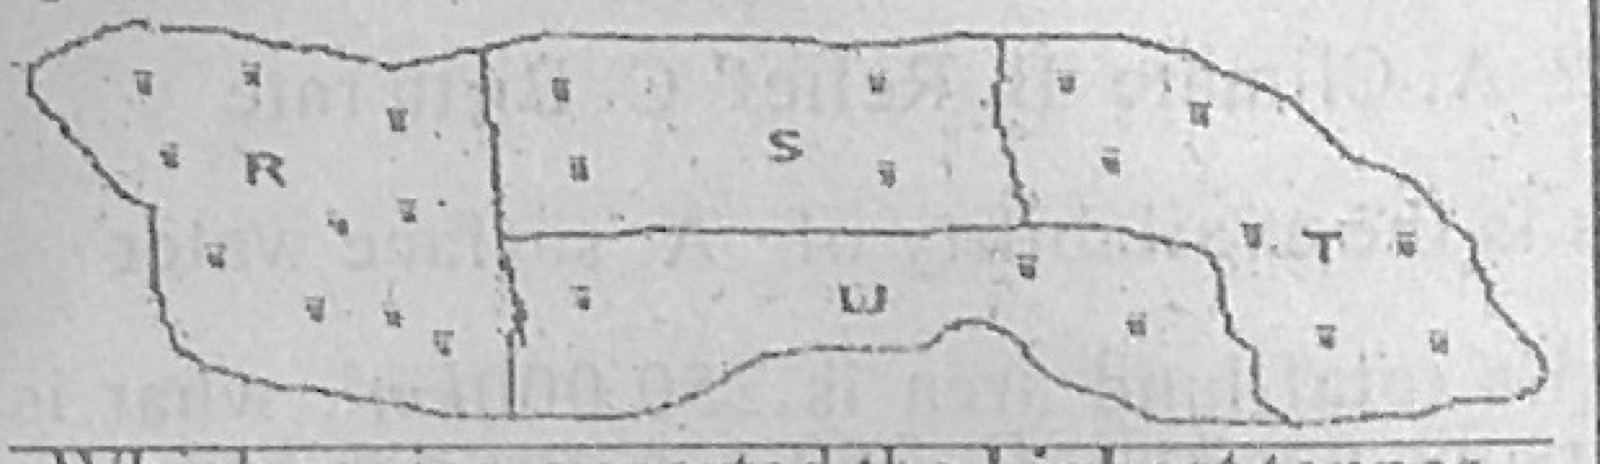
Statistical Maps and DiagramsFigure 1 represents the export of rice by four regions in Country XX in the year 2009. One dot represents 20,000 tonnes of exported rice was used as the scale of the dot map. Study the dot map to answer this question. Which region exported the highest tonnes of rice?
- A.R
- B.U
- C.S
- D.T
Show the answer and explanation
Answer: A (R)
Explanation
Region R has the most dots (10 dots = 200,000 tonnes).