Theory question 302
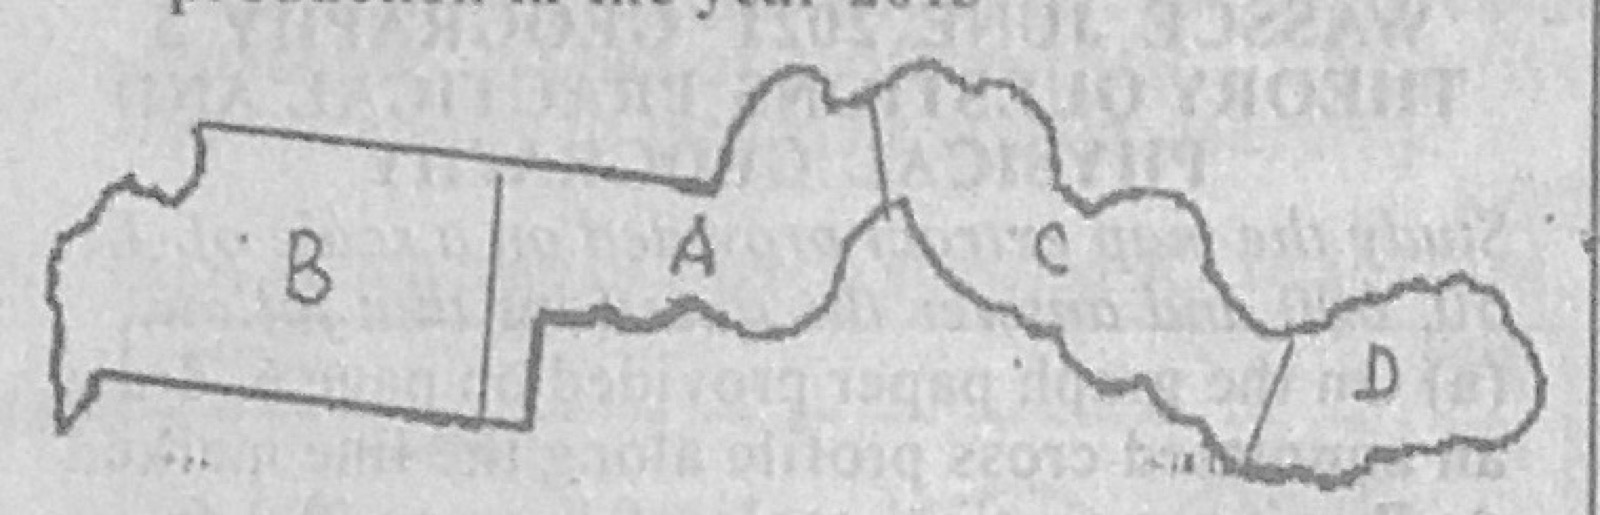
Statistical Maps and DiagramsThe Table X below contains data on the distribution of Groundnut production in four regions of country M in the year 2013. Use the data in the table to answer the questions that follow.
Table X
Country A: 100,000 metric tonnes
Country B: 260,000 metric tonnes
Country C: 200,000 metric tonnes
Country D: 80,000 metric tonnes
(a) Using the map of country M and a scale of one dot to represent 20,000 metric tonnes, produce dots to represent the data. (b) State three disadvantages of dot maps.
Show the model answer
(a) Number of dots = production ÷ 20,000: A = 5 dots; B = 13 dots; C = 10 dots; D = 4 dots. Copy the outline of Country M with regions A-D, place dots of equal size evenly in each region, and add a title and key (1 dot = 20,000 metric tonnes).
(b) Exact values are hard to read off; fractions of the dot value cannot be shown; dots crowd together and merge in high-value areas; spreading dots evenly hides the real distribution within a region; choosing a suitable dot value is difficult; dots may fall on areas where the crop is not grown (lakes, hills); slow to draw.
Work out each region's dots first.