Theory question 302
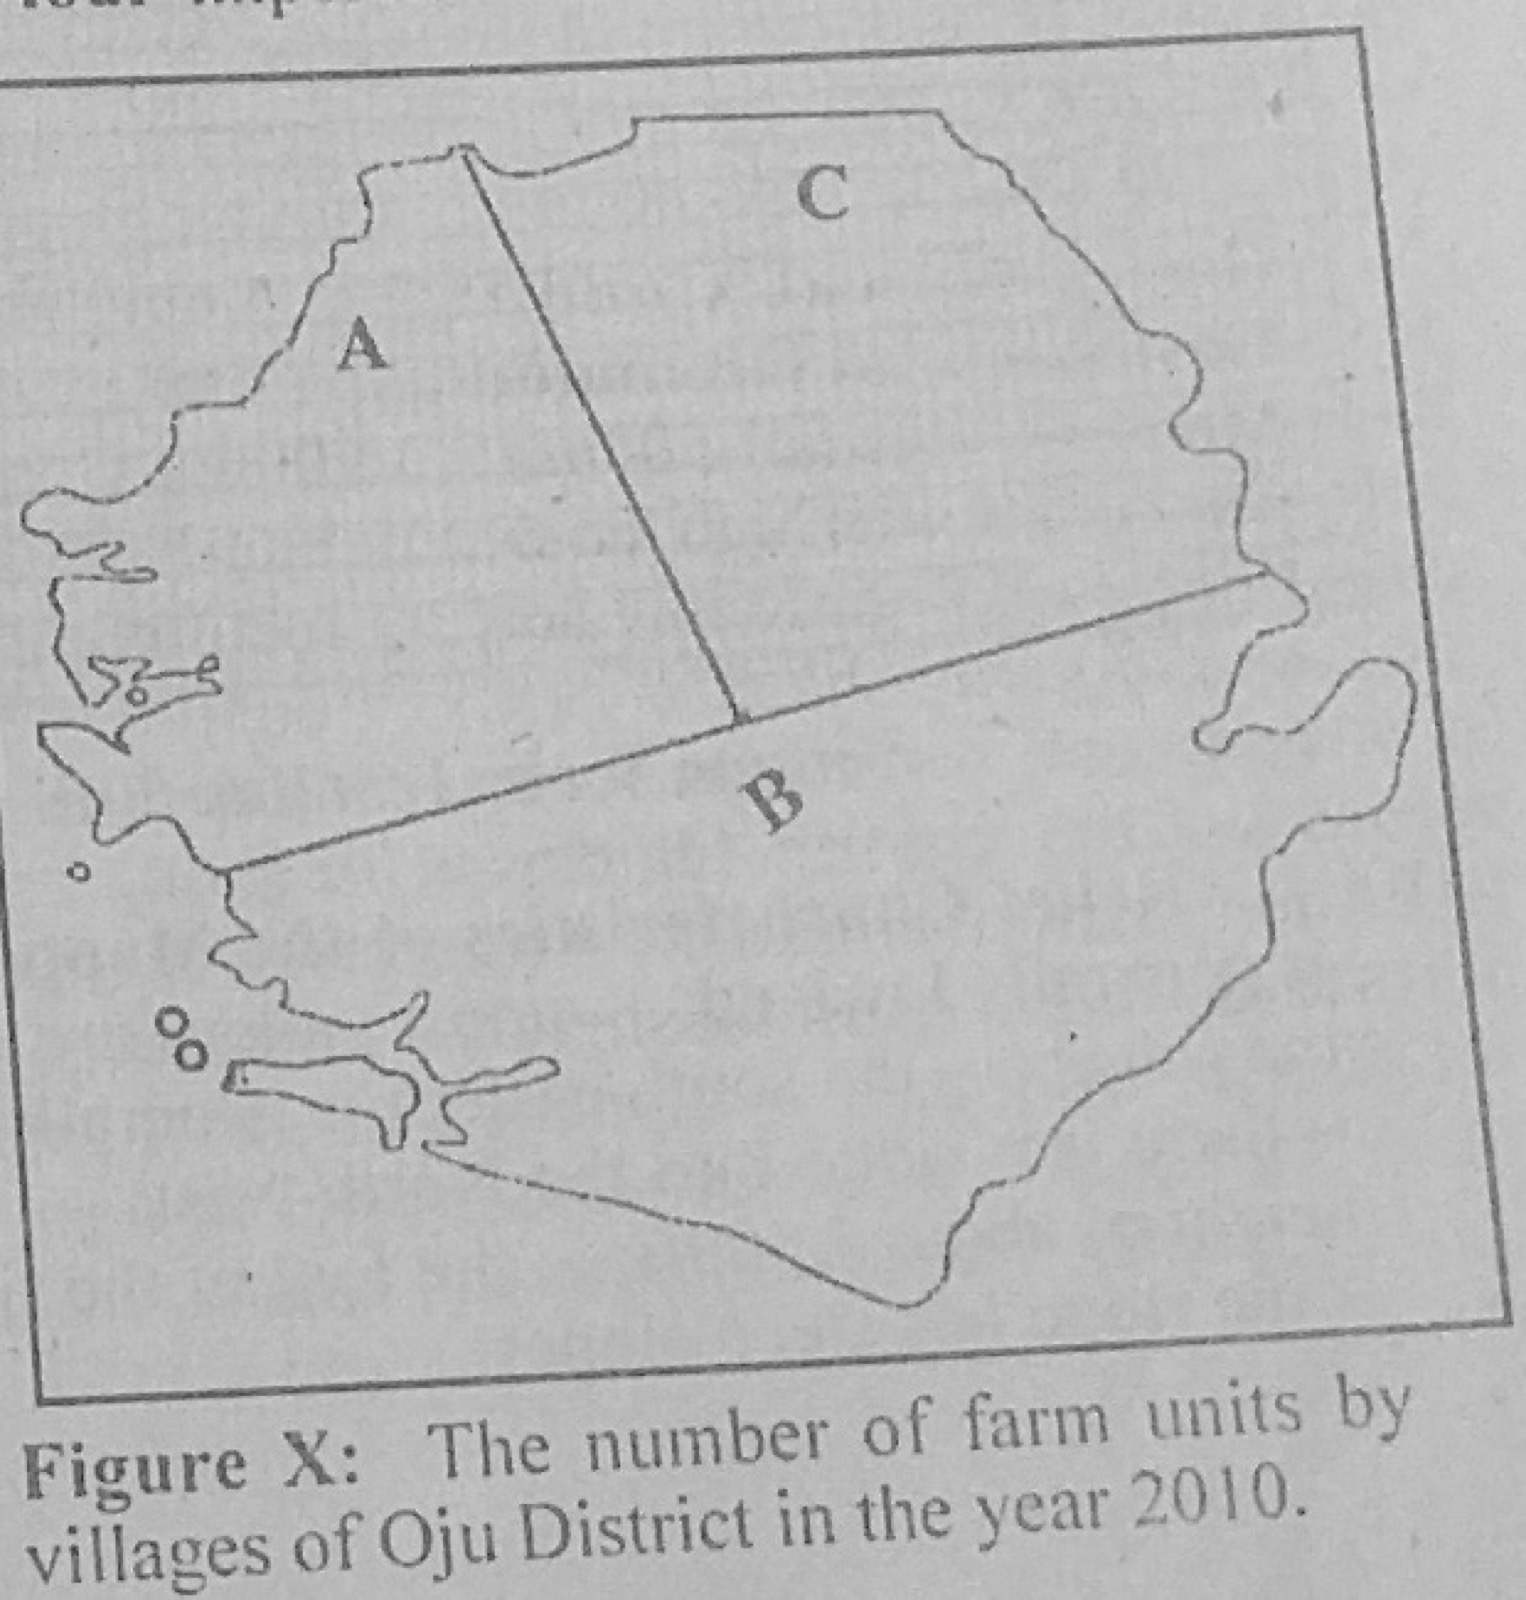
Statistical Maps and DiagramsThe Table X below shows the number of farm units in three villages of Oju District in the year 2010. Use the data in Table X to answer the questions that follow.
Village A: 81
Village B: 100
Village C: 64
(a) Using the map of Oju District provided and a radius of 1 cm to represent 3 farm units, construct proportional circles to represent the data. (b) State two disadvantages of proportional circles.
Show the model answer
(a) Square roots: A = √81 = 9; B = √100 = 10; C = √64 = 8. Radii at 1 cm to 3 units: A = 9 ÷ 3 = 3.0 cm; B = 10 ÷ 3 ≈ 3.3 cm; C = 8 ÷ 3 ≈ 2.7 cm. Draw each circle centred in its village area on the map of Oju District, with a key and title.
(b) Calculation of square roots takes time; circles may overlap and cover the map; it is hard to compare areas of circles accurately by eye; exact values cannot be read off easily; large circles may not fit small regions.
Use the square root of each value for the radius.