Question 14
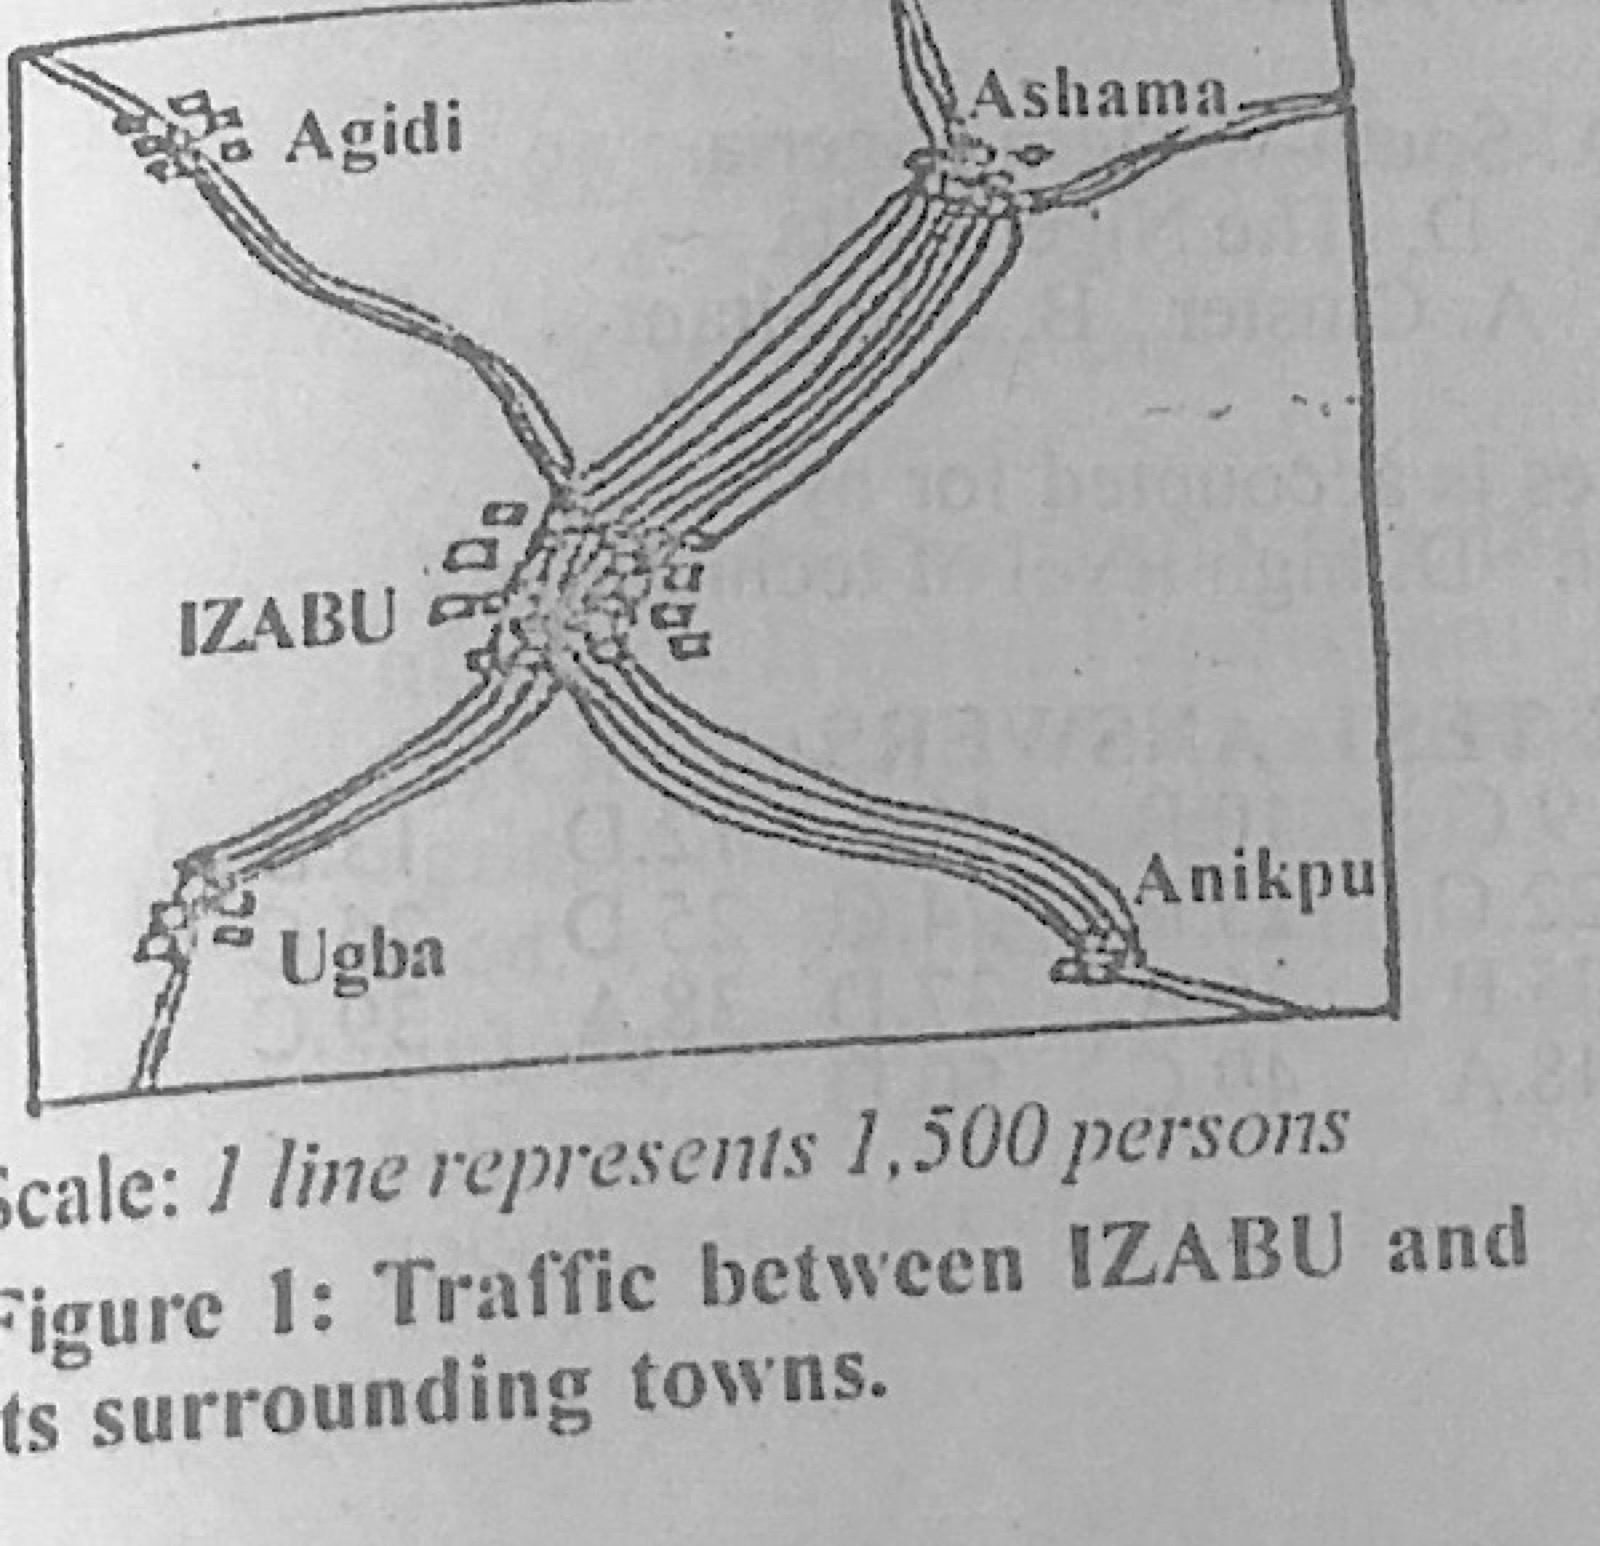
Statistical Maps and DiagramsFigure 1 shows the volume and direction of passenger traffic between IZABU town and its surrounding towns in the year 2001 (scale: 1 line represents 1,500 persons). Use it to answer this question. One major advantage of the figure is that, it
- A.is easy to construct.
- B.shows quantity and direction together.
- C.is easy to interpret.
- D.involves mathematical calculation.
Show the answer and explanation
Answer: B (shows quantity and direction together.)
Explanation
A flow map shows both how many people move and where they move to.