Theory question 302
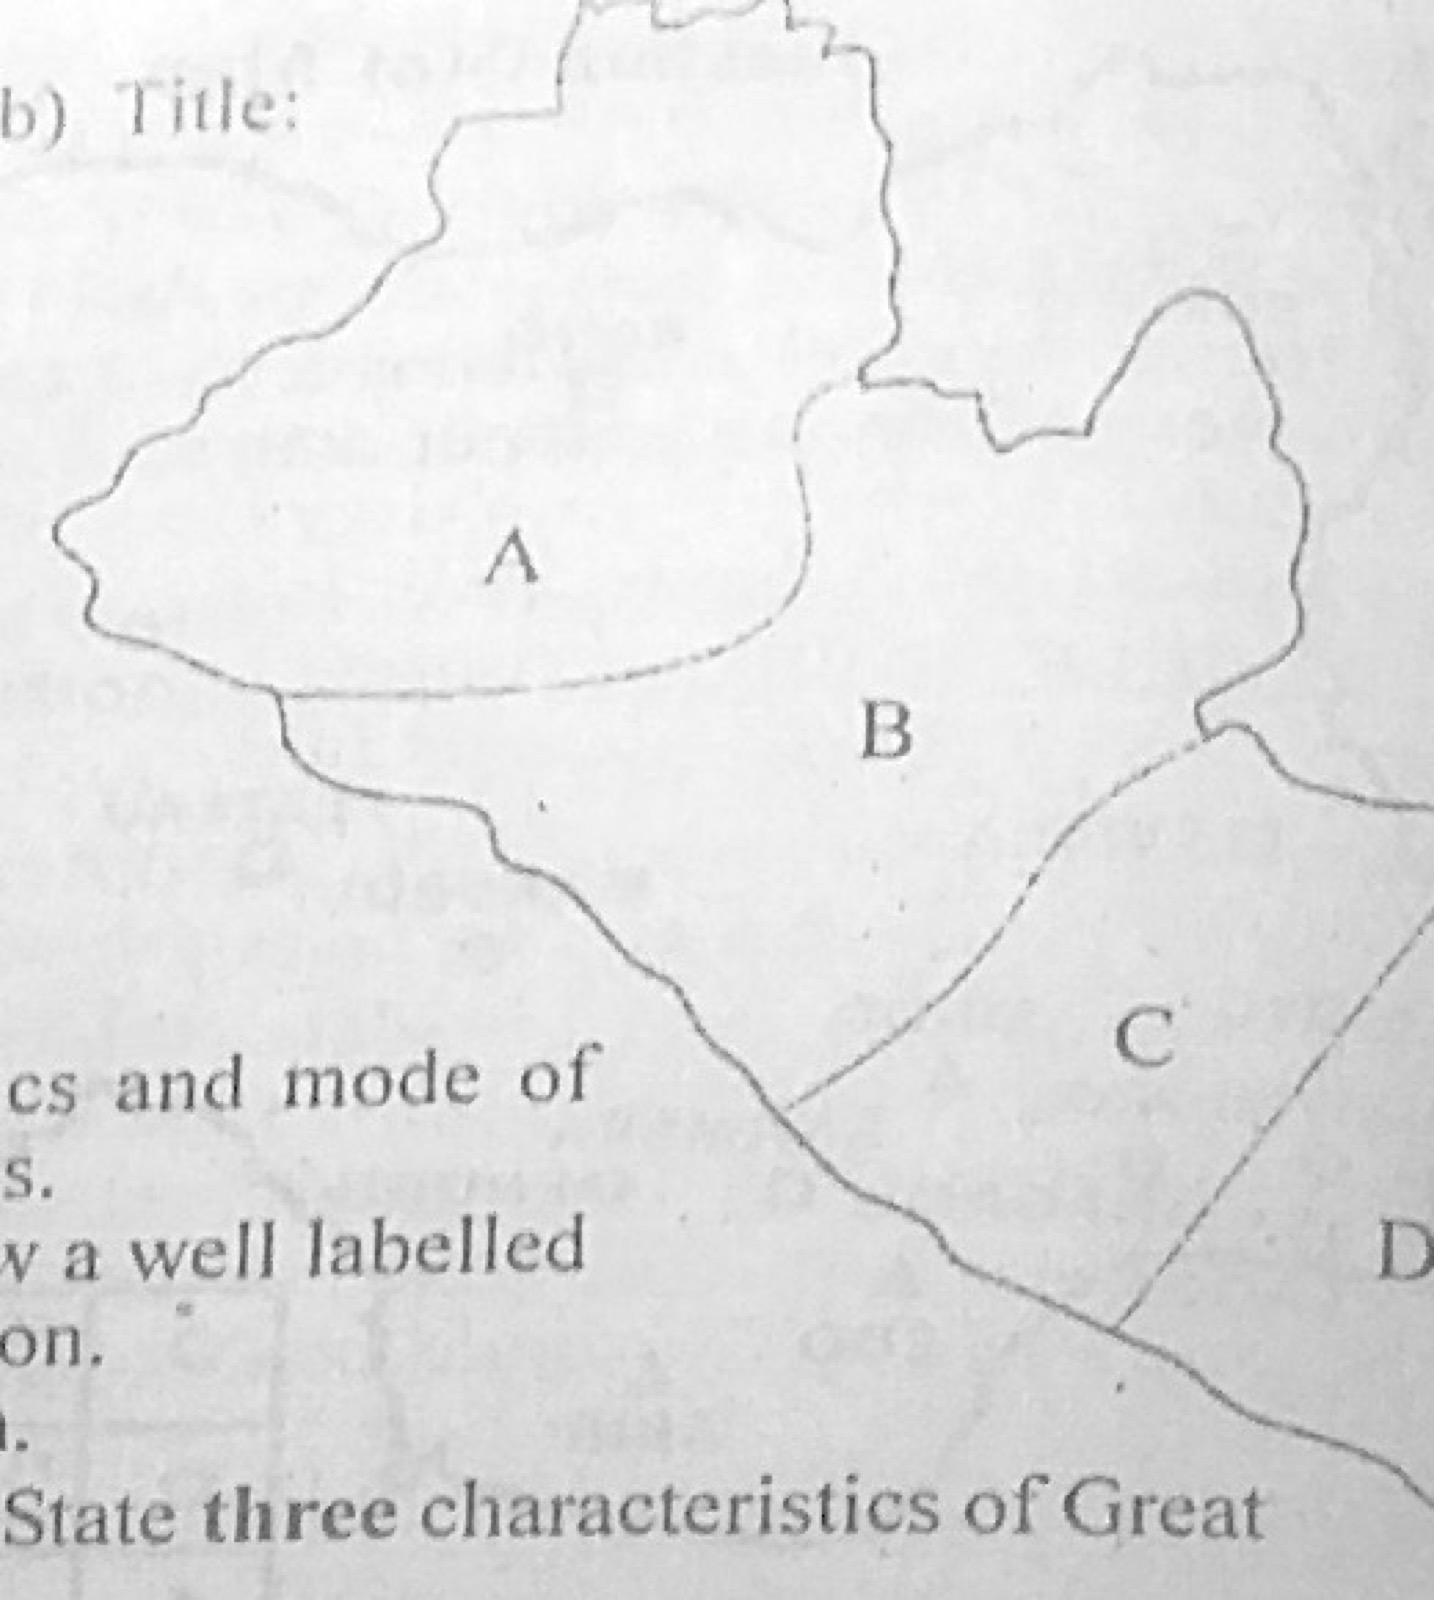
Statistical Maps and DiagramsThe Population distribution in the regions of Country M in the year 2011 is represented in the table below. Use the data to answer the questions that follow:
Region A: 100,000
Region B: 380,000
Region C: 160,000
Region D: 220,000
(a) Using the map on page 3 and a scale of one dot to represent 20,000 persons, produce a dot map for Country M. (b) On the dot map produced in 2(a), suggest a suitable title. (c) State two advantages of dot maps.
Show the model answer
(a) Number of dots = population ÷ 20,000: A = 5 dots; B = 19 dots; C = 8 dots; D = 11 dots. Copy the outline of Country M with regions A-D and place the dots, all the same size, evenly within each region; add a key (1 dot = 20,000 persons).
(b) e.g. 'Dot map showing the distribution of population in the regions of Country M in 2011'.
(c) Gives a clear visual impression of distribution and density; easy to understand; actual figures can be worked out by counting dots; easy to construct; shows absolute values; allows easy comparison between regions.
Show the dot calculation for each region.