Question 14
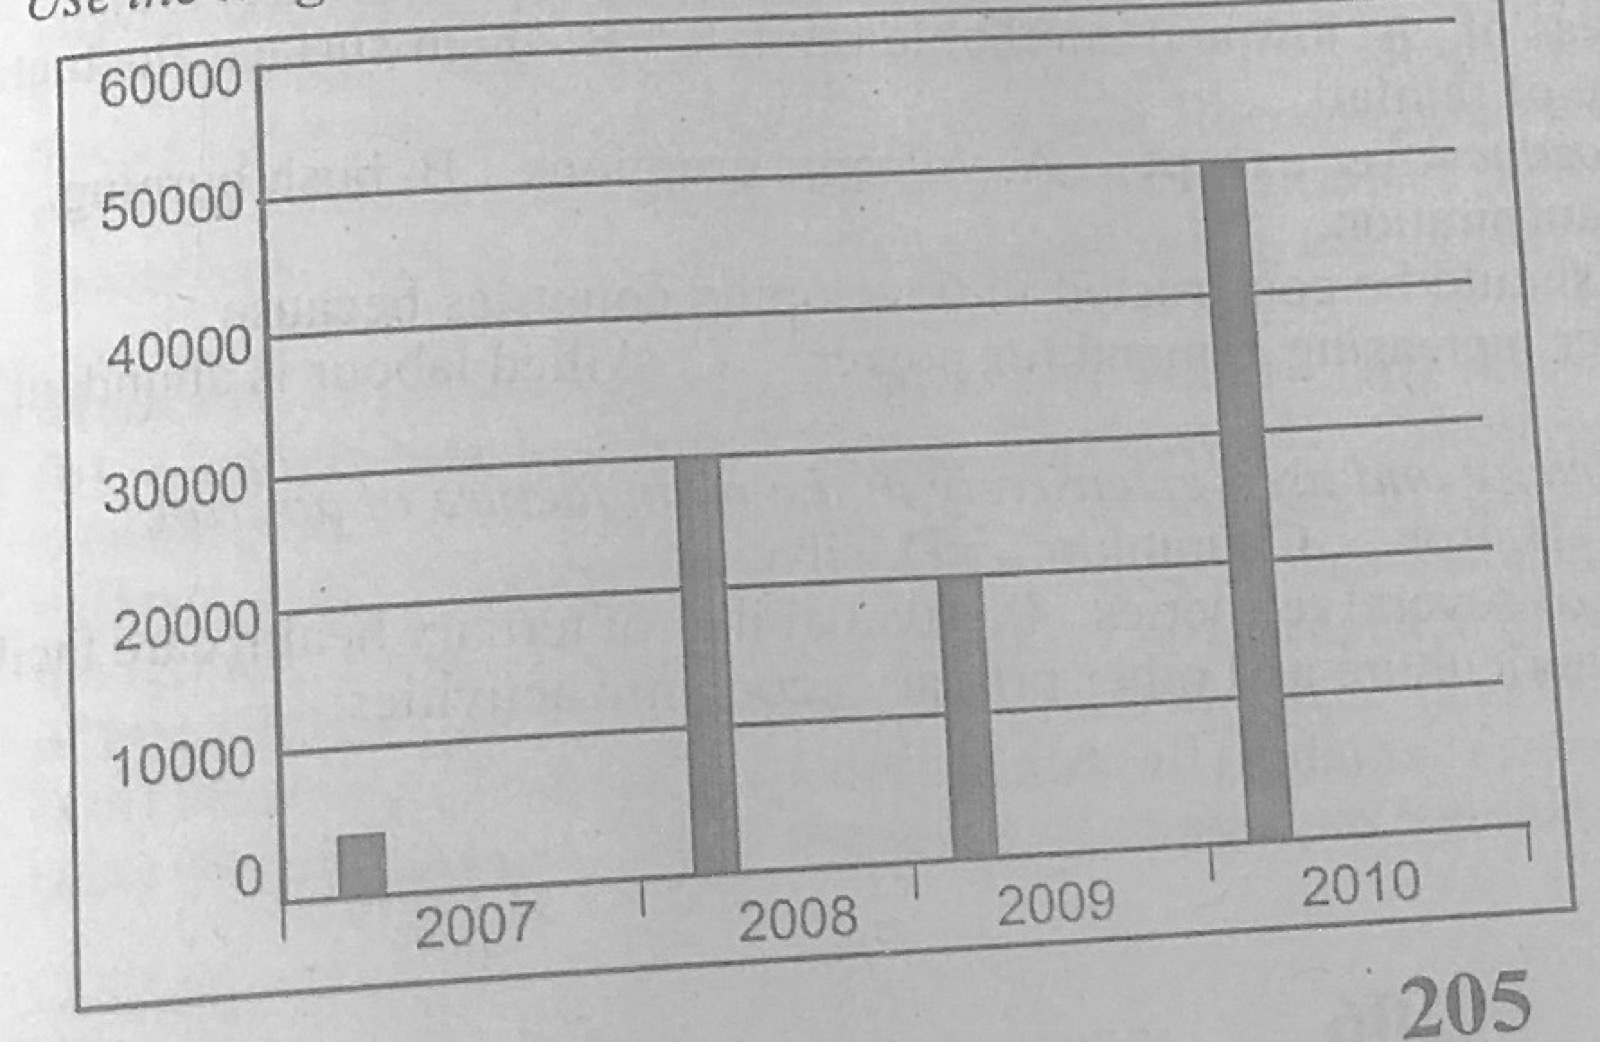
Statistical Maps and DiagramsThe diagram represents the export of rice in kilogrammes from Country X between 2007 and 2010. Use it to answer this question. In which year did Country X have the highest production of rice?
- A.2007
- B.2008
- C.2009
- D.2010
Show the answer and explanation
Answer: D (2010)
Explanation
The 2010 bar is the tallest.