Theory question 302
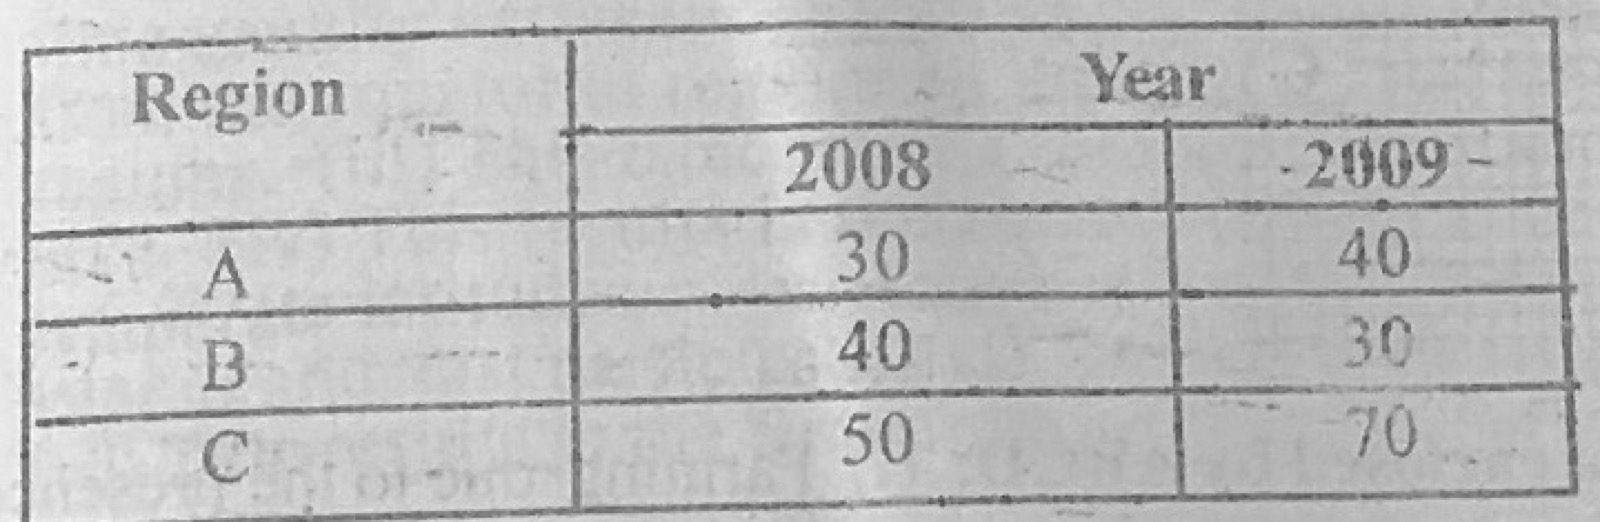
Statistical Maps and DiagramsUse the data in the table below to answer the questions that follow. Production of cocoa in country Z (in thousand tonnes) for 2008 and 2009 from three production regions A, B and C.
Region A: 2008 30; 2009 40
Region B: 2008 40; 2009 30
Region C: 2008 50; 2009 70
(a) Construct a multiple bar graph to show the data. (b) Outline any three advantages of the method used.
Show the model answer
(a) Title; vertical axis 'Production (thousand tonnes)' with a scale such as 1 cm = 10 thousand tonnes from 0 to 70; horizontal axis with regions A, B and C; for each region two bars side by side (2008 and 2009) drawn to the correct heights (A 30 and 40; B 40 and 30; C 50 and 70); different shading for each year with a key; equal bar widths and gaps between regions.
(b) Easy to construct; easy to read and understand; makes comparison between years and regions easy; actual values can be read off; shows changes (rise in A and C, fall in B); attractive.
Use the same shading for each year throughout.