Theory question 202
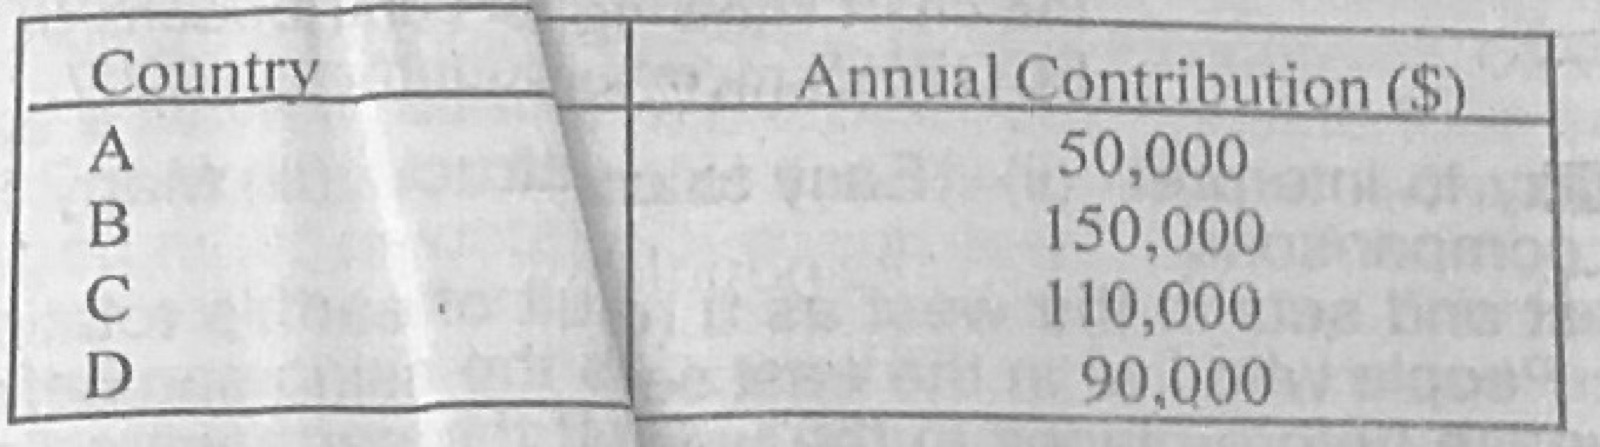
Statistical Maps and DiagramsFour Economic Community of West African States (ECOWAS) member countries contributed to a capital project in the sub-region in 2007 as shown below:
Country A: $50,000
Country B: $150,000
Country C: $110,000
Country D: $90,000
(a) Illustrate the information above in a pie chart. (b) State two advantages of using pie chart.
Show the model answer
(a) Total = $400,000. Angles: A = 50,000/400,000 × 360° = 45°; B = 135°; C = 99°; D = 81° (sum 360°). Draw a circle of suitable radius, measure the sectors with a protractor from a vertical radius, shade/label each country with its value or percentage (A 12.5%, B 37.5%, C 27.5%, D 22.5%), title and key.
(b) Simple and attractive; easy to compare each part with the whole; easy to understand at a glance; shows many items in one diagram; easy to construct.
Show the working of every angle.