Question 18
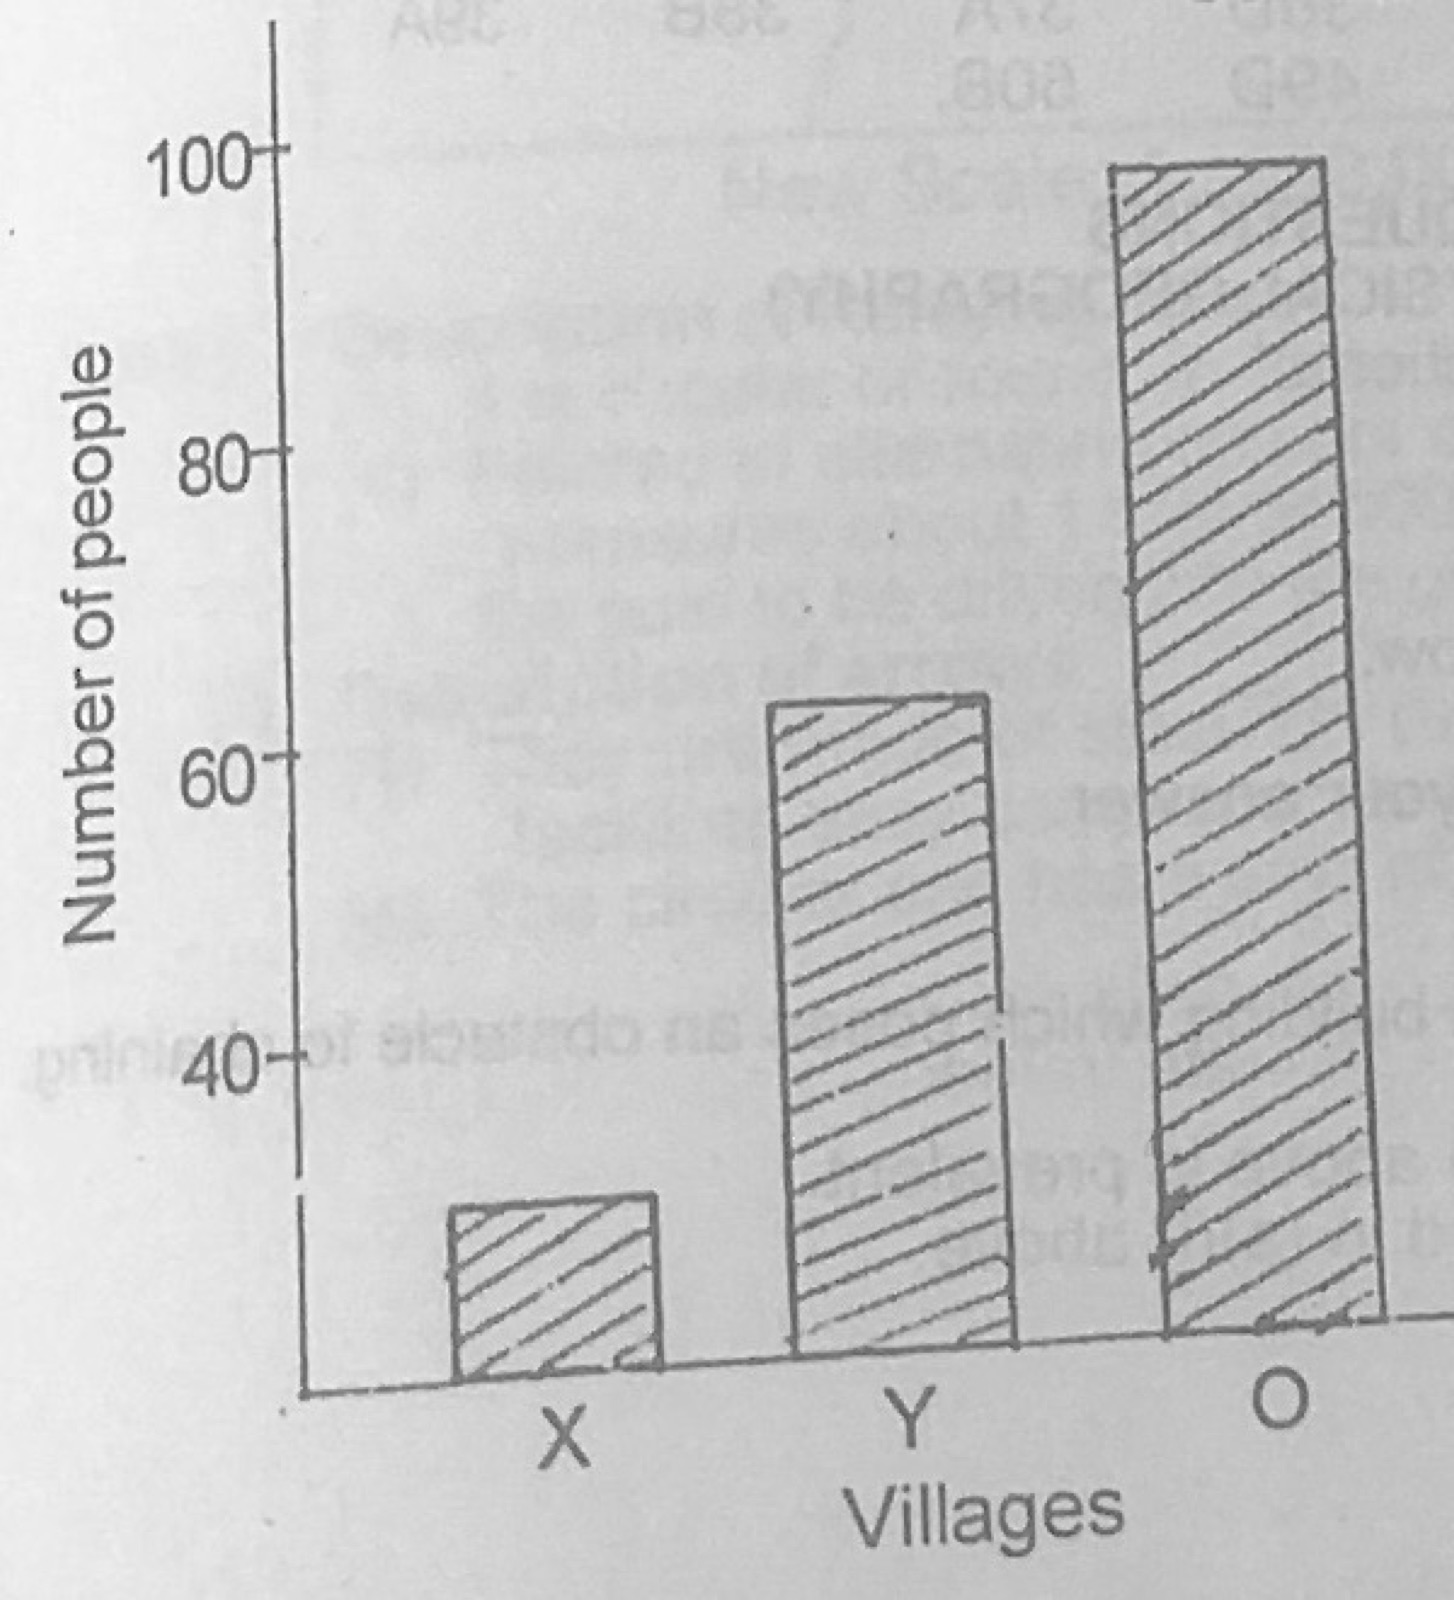
Statistical Maps and DiagramsUse the diagram (number of people in villages X, Y and O) to answer this question. The diagram above is a
- A.dot map.
- B.pie chart.
- C.flow chart.
- D.bar graph.
Show the answer and explanation
Answer: D (bar graph.)
Explanation
Separate rectangular bars whose heights show quantities make a bar graph.